Better Shopify Reporting
Shopify Reports Done Better: GA4 Confusing? Shopify Analytics Limiting? Say Hello To The Data You Need
Shopify Analytics Done Better, Here Is Why
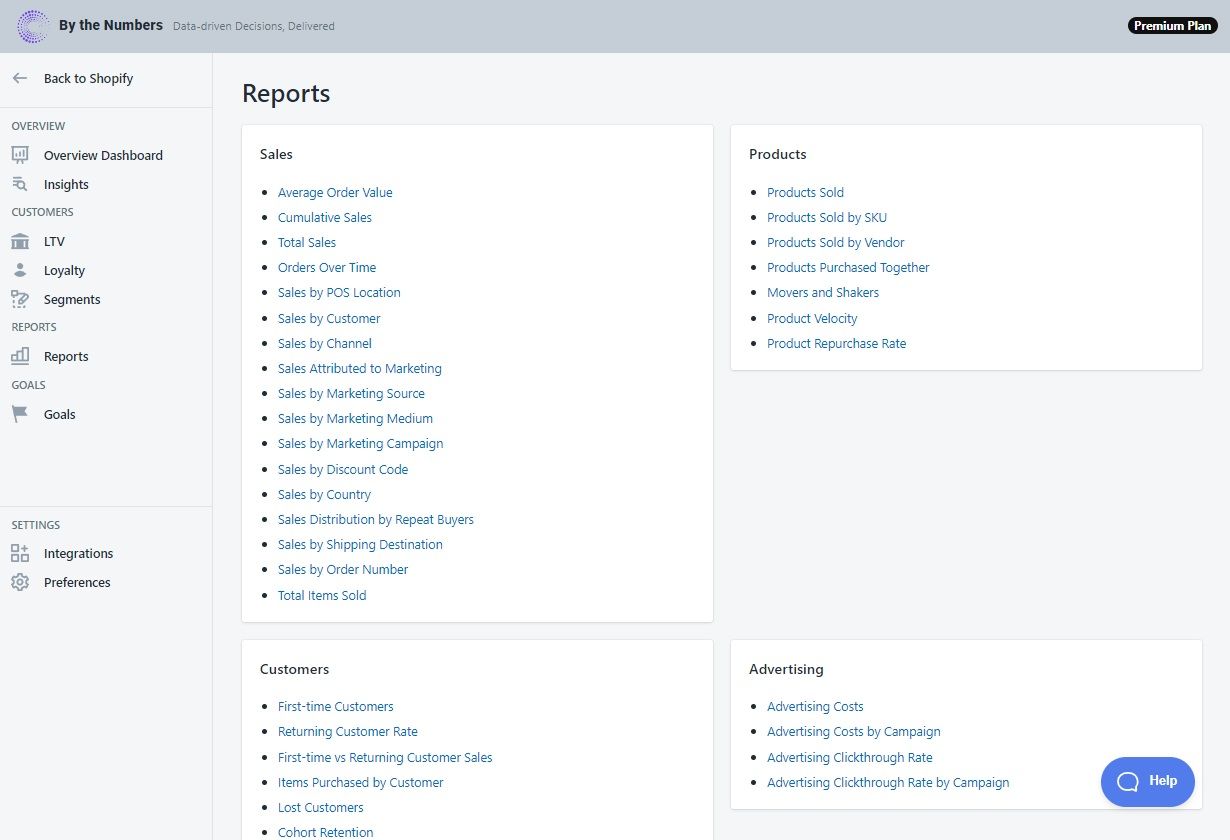
Finding the reports or information you need can often be a hassle. By The Numbers simplifies the process by giving you a better Shopify reporting experience than Shopify Analytics
Our Reports Include:
- Comprehensive Sales Reports: Get insights into sales volume, customer purchases, purchase frequency, and more.
- Superior Product Reporting: Understand customer behavior with reports on products purchased together, top-selling products, trendsetters, and more.
- Thorough Advertising Reports: Dive deeper into your customer base with loyalty reports, enhanced cohort analysis, RFM (Recency, Frequency, Monetary) reporting, and automated customer segmentation.
- Advertising Reports with Detailed ROI Analysis: Measure the effectiveness of your advertising spend with detailed ROI reports.
- Useful AI-Generated Insights: Leverage the power of artificial intelligence for deeper insights and predictive analytics.
- Effective Goal-Setting & Tracking: Set business goals and use AI to monitor your progress towards achieving them.

What Makes Our Shopify Reporting Better
Here’s only some of the things you get:
- Superior Dashboards that are easy to navigate to get what you need
- Customer Reports that are easy to read and helps you see HUNDREDS of scenarios
- Product Reports that reveal which products you need to invest in more
You get the crucial data you need to execute effortless but effective marketing campaigns.
Before you move forward with any business decision, you have our multiple reports to look act before making any decision.
Stop guessing—start acting on data with By The Numbers.
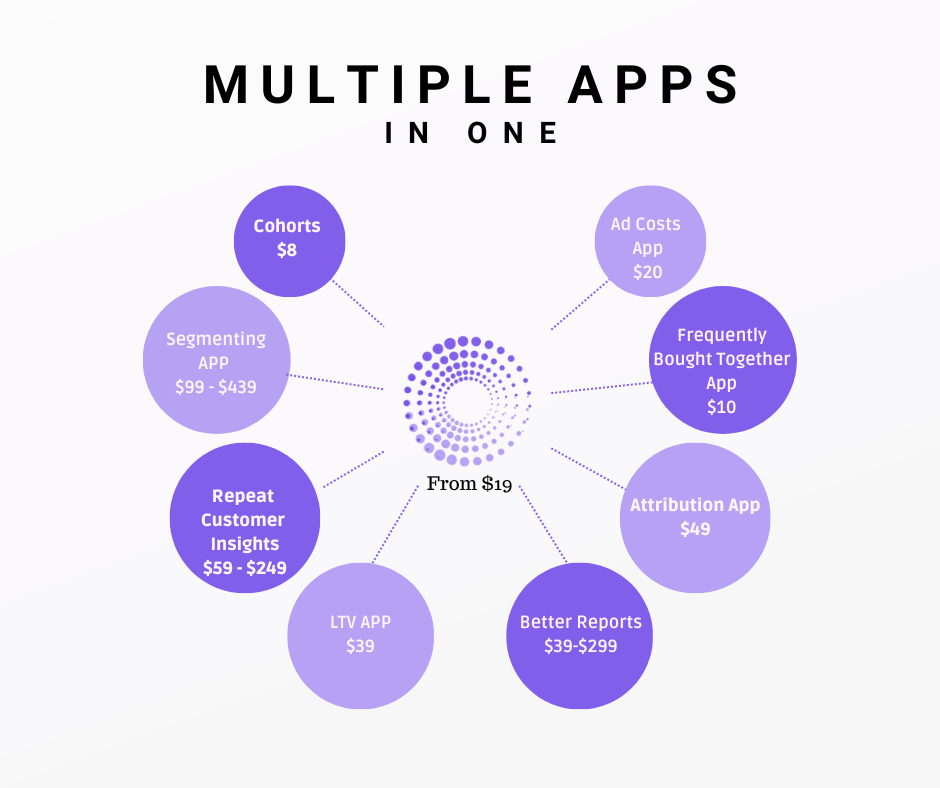
Multiple Apps Put Into One
We Combine What Could Be Multiple Shopify Apps Into Just One. Such as
- Frequently Bought Together
- RFM Reporting
- Loyalty Reports
- AI Insights
- Prediction Tools
- Movers & Shakers
- Automated Segmentation
- And Much More
Giving you one place & one app to view all of your data. Saving you $$$ and reducing the load on your store with multiple apps. Try it out today!


How The Right Data Analytics Platform Only Helps Your Business
Here’s what Mckinsey found out about successful businesses:
- Data driven organizations are 23x more likely to acquire customers
- Data driven organizations are 6x more likely to retain these customers
- Data driven organizations are 19x more likely to be profitable.
Knowing all of this, you know how important it is to have data for your business. But two concerns arrive
- What kind of data do you need?
- After you get the data, how do you use it to drive decisions?
These are the same questions that multi-million brands like Chamberlain Coffee, and Victoria Beckham had when they were looking for the right analytics app to grow their stores.
There are multiple areas you can cover, but if you do this on your own, you risk going down a path that will slow your business down. It’s why we have multiple stores coming to us. No one can afford to go down the wrong path. No one should either.
After doing this process with countless stores we saw that there was a common trend and we started to adjust our methods to maket the process for stores much easier.
With each brand we broke up their store into four categories
- Product – your foundation, the reason why your consumers come to you
- Customer – the people that drive your business
- Advertising – the efforts you make to attract your customers
- Sales – the end of this cycle and what sustains your business
With multiple reports in each category, you see your store through every angle possible.
You answer every question possible:
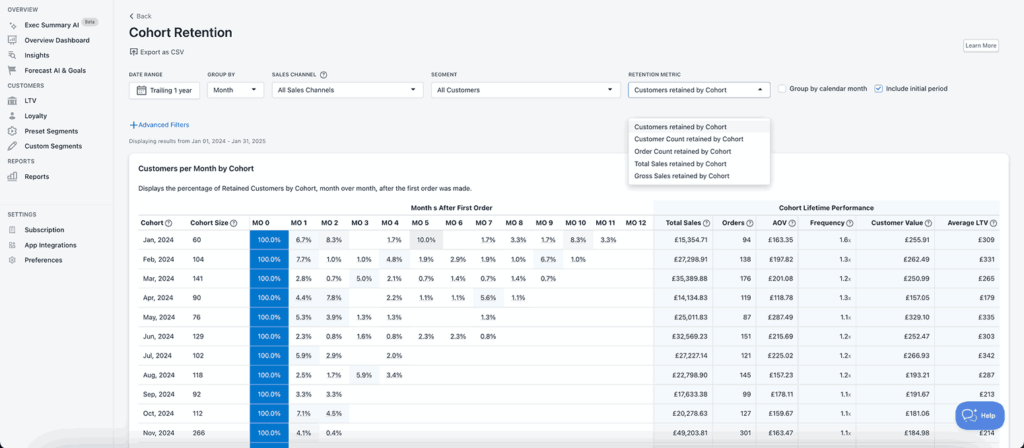
- How are my customers from August 2024 doing? Our Cohort Retention Report has the answer
- Where in the world do my customers come from? Sales by Location Report has the answer
- How did my last Google Ads campaign do? Advertising Clickthrough Rate by Campaign has this answer.
- How does your best product perform in terms of customers, orders and items sold? The Product Velocity Report will give you the answer.

Above is our cohort analysis. The big report that our customers love to use. It’s the one of the many reports that we’ve perfected and will show which cohort is doing well. This let’s you study them and their journey, then apply it to ensure your other cohorts do well too.
We’ve always held the belief that it doesn’t matter if you can sell to customers, if they don’t return, you’re in trouble. This report let’s you see how each group of customers (above they are grouped by the month they made their first order) are doing.
You see details about them like how they interacted with your Google Ads, what their Average Order Value (AOV), and how many orders they’ve placed.
This report alone can show you how your efforts with your customers are doing and where you need to improve. It provides an endless opportunity of growth for your business.
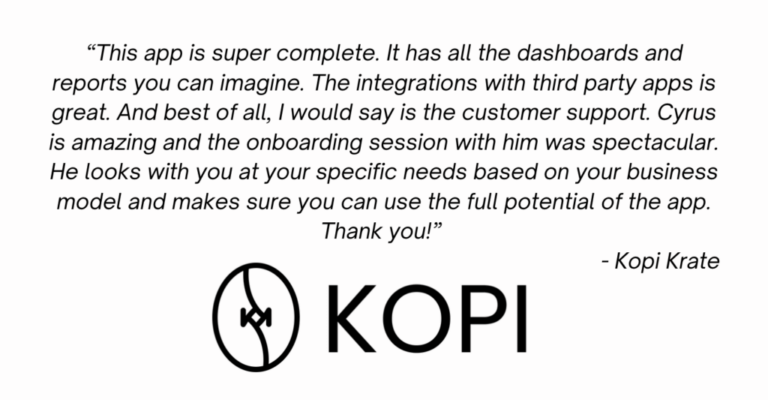
Client Testimonials


READY TO TAKE YOUR Shopify Reports TO THE NEXT LEVEL?
Get a free demo by a Shopify data expert and see what all the fuss is about!
Or get started with a Start A Free Trial


