Quickest Way to Calculate Cumulative Sales on your Shopify Store:
Two Ways Of Calculating the Cumulative Sales of your Shopify Store
Running a successful e-commerce business requires monitoring and analyzing sales data. Measuring Cumulative Sales can give you insights into the sales aggregate in a particular time range. You can compare customers’ buying behavior regarding how long it takes for your shop to reach a certain amount of sales in different time frames.
Understanding Cumulative Sales:
Before you dive into the calculations, it’s essential to get a solid understanding of cumulative sales. These sales represent your store’s total revenue over time, including all individual sales, whether daily, weekly, monthly, or during any other period you wish to analyze. This understanding is crucial as it forms the basis of your calculations and helps you interpret the data accurately.
Steps to Calculate Cumulative Sales on Shopify:
Shopify offers a great range of sales reports but not a specific Cumulative Sales report. Nevertheless, there are two ways of analyzing this metric.
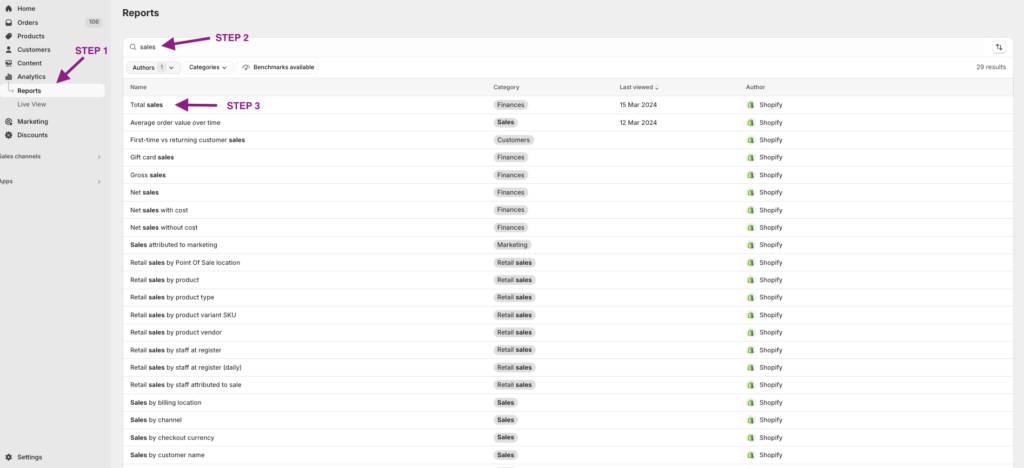
Step 1: Navigate to the Analytics Section:
Once logged into your Shopify account, click ‘Analytics’ on the left-hand side menu. There, you’ll find the ‘Reports’ section, which gives you easy access to various reports, such as sales by product, sales by channel, and sales over time.
Step 2: Identify the Total Sales Report:
You can type it into the search box or look for it among the other available reports.
Step 3: Click on the Total Sales Report
Click to access the data on the Total Sales of your store.
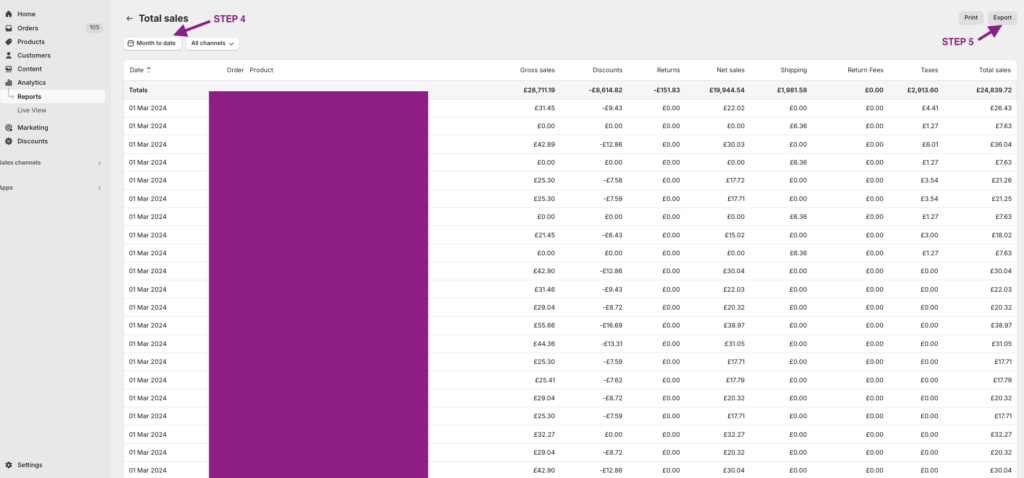
Step 4: Customize the Time Frame
Choose the desired timeframe for analyzing cumulative sales. You can select a specific date range or opt for pre-set options like “Last 7 days,” “Last 30 days,” or “This month.”
Step 5: Export the Sales Report for Further Analysis:
Click on the ‘Export’ button to download the sales report in CSV format. This file contains valuable sales data, such as order numbers, sale dates, and corresponding revenue. The ability to export this data is a practical feature that allows you to delve deeper into your sales analysis.
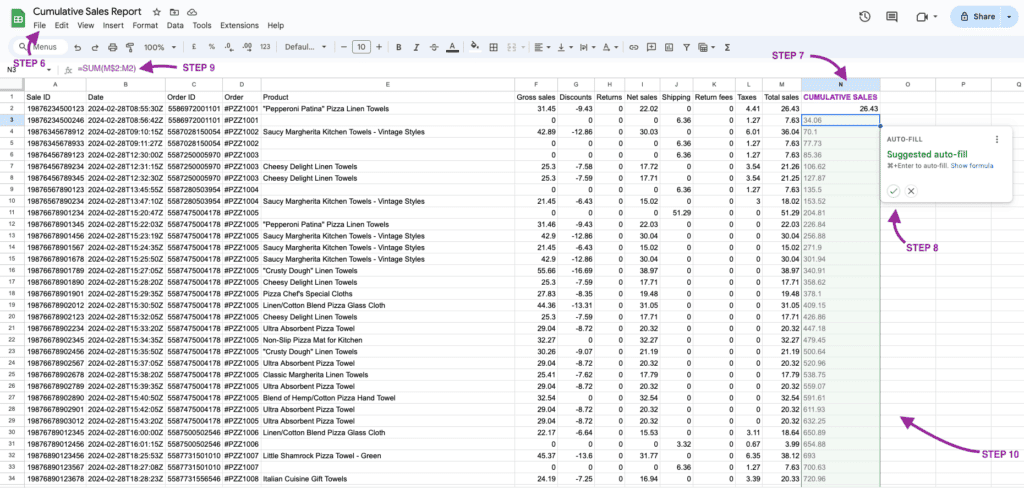
Step 6: Open the CSV File:
Once downloaded, open the CSV file using spreadsheet software like Microsoft Excel or Google Sheets. This step allows you to manipulate and analyze the data effectively.
Step 7: Create a New Column for Cumulative Sales:
Insert a new column beside the “Revenue” column (typically column J) and label it as “Cumulative Sales.”
Step 8: Input the Cumulative Formula:
In the first row of the “Cumulative Sales” column (row 2), enter the formula “=SUM(J$2:J2)” and press Enter. This formula calculates the cumulative revenue by adding the revenue values from the first row up to the current row.
Step 9: Apply the Formula to the Entire Column:
Applying the cumulative formula to the entire column is straightforward. Simply hover your mouse over the small square at the bottom right corner of the selected cell until it turns into a plus sign. By clicking and dragging downwards, you’ll extend the formula to the entire column, ensuring all your data is accurately calculated.
Step 10: Analyze and Interpret the Data:
Once you have calculated cumulative sales, analyze the trends and patterns within the data. Look for growth trends, identify spikes in revenue, and compare performance across different timeframes. This analysis will help you make informed decisions to optimize your store’s performance.
Once you have calculated cumulative sales, analyze the trends and patterns within the data. Look for growth trends, identify spikes in revenue, and compare performance across different timeframes. This analysis will help you make informed decisions to optimize your store’s performance.
Are you interested in knowing the cumulative sales of specific groups of your audience? With By the Numbers custom audience segmentation capabilities, you can learn all the members of your audience who share one or more characteristics. You can use preset segments straight away, but you can also create personalized ones.
How to Calculate Cumulative Sales on Shopify using By the Numbers
Step 1: Install the By the Numbers App for Comprehensive Analytics
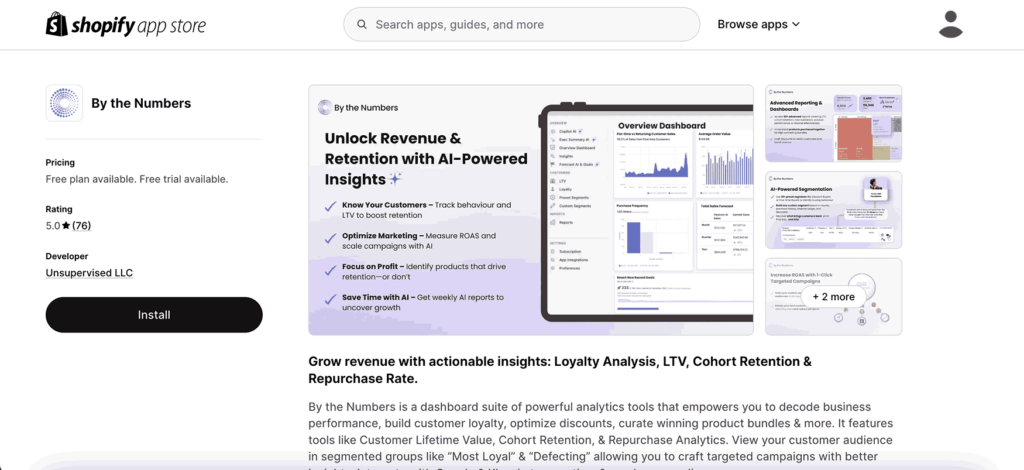
Start by installing the By the Numbers app from the Shopify App Store. This powerful tool provides comprehensive analytics and reporting features, allowing you to track and analyze your store’s sales data more efficiently and effectively.
Step 2: Access the By the Numbers Dashboard and Navigate to the Sales Reports Section
Once installed, click the app icon on your Shopify dashboard to access the By the Numbers app’s main dashboard. Here, you can find a wide range of data analysis features. Click on ‘Reports’ on the left side of the app. This section allows you to access various reports related to your sales, customers, products, and advertising.
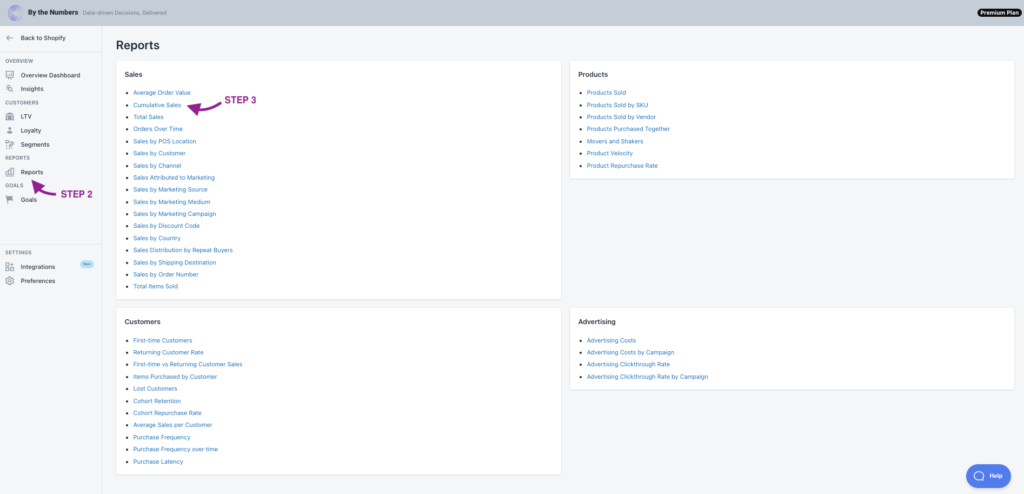
Step 3: Choose the Cumulative Sales Report
In the Sales section, locate and select the “Cumulative Sales” report. This report focuses explicitly on calculating and presenting cumulative sales data over a given timeframe.
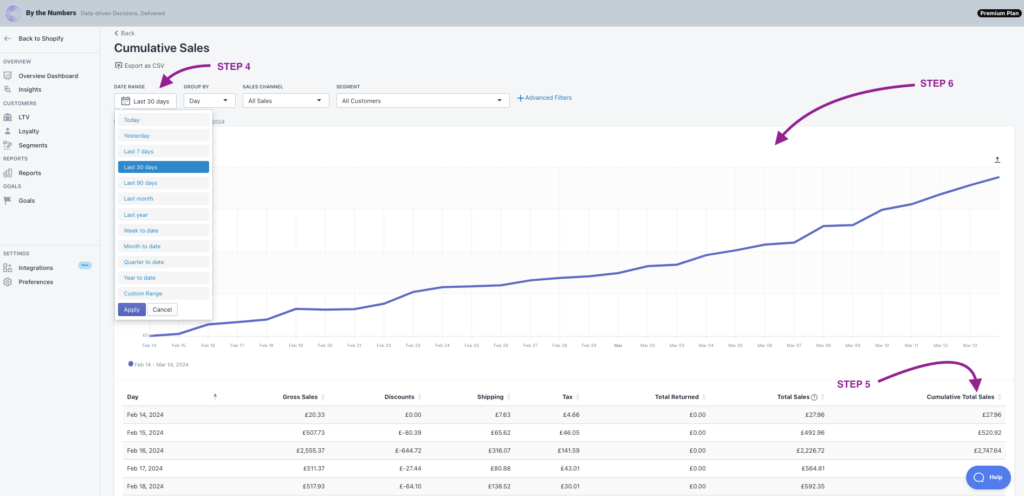
Step 4: Set the Date Range
Upon selecting the Cumulative Sales report, you will be prompted to set the date range for the analysis. Choose the desired period for which you want to calculate cumulative sales. You will find predetermined time frames, but you can also set a custom one.
Step 5: View Cumulative Sales Data
After setting the date range, the By the Numbers app will generate the cumulative sales report based on the selected timeframe. This report will display the cumulative sales figures for each day, week, month, or custom time interval and create a graph to make it as visual as possible.
Step 6: Analyze and Interpret the Cumulative Sales Report
Once the cumulative sales data is presented, take the time to analyze and interpret the trends and patterns within the report. Depending on the nature of your Shopify store, you can group the results by day or month.
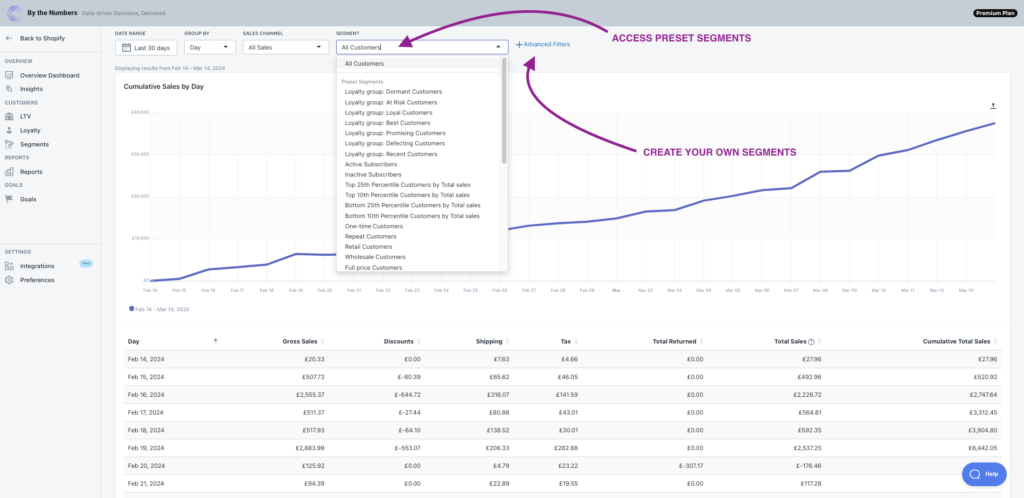
GAME CHANGER BONUS: Custom Segmentation of Cumulative Sales
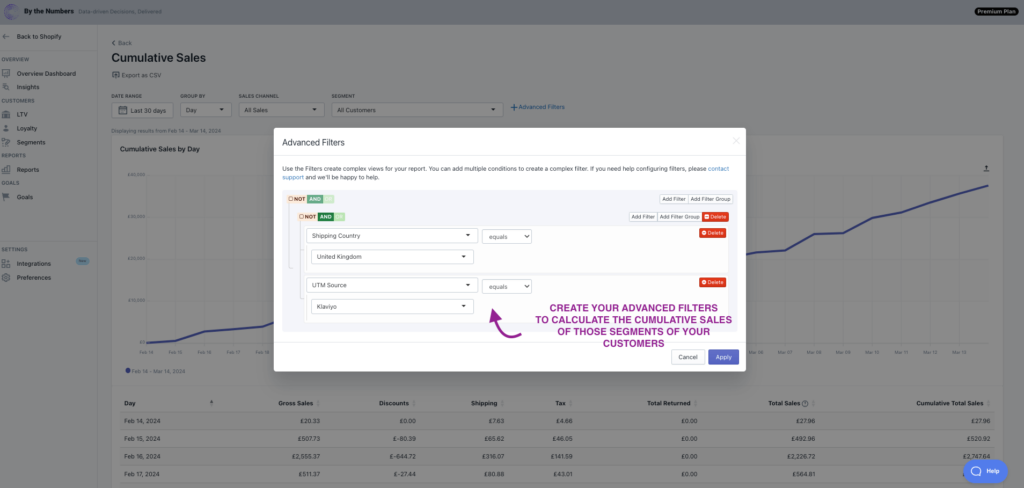
By the Numbers offers extra filtering by sales channel and custom segmentation, which is its premium feature. Pick one of the app’s pre-made segment groups based on your customer’s loyalty (Best Customers, At Risk Customers, Dormant Customers) or choose who to address by segmenting according to their behaviour (One Time Customers, Return Customers). If none fit your needs, create advanced filters and go as far as your imagination takes you.
Get a free demo by a Shopify data expert and see what all the fuss is about!
READY TO TAKE YOUR BUSINESS TO THE NEXT LEVEL?
Or get started with a Start A Free Trial


