
How to See Sales Distribution by Repeat Buyers on Shopify
Explore your Total Sales Attributed to Different Buyer Categories
This article will guide you through analyzing your Total Sales Distribution by Repeat Buyers. Unlike Shopify, which lacks a report that can provide this insightful data, By the Numbers is a unique solution. It not only highlights the percentage of your total sales from one-time, two-time, etc. buyers but also provides the Average Order Value (AOV) for each group. With just a few clicks, this app enables you to understand where your sales are coming from, providing valuable insights to drive your business forward.
Find Your Repeat Buyers' Sales Distribution on Shopify
Find Your Repeat Buyers' Sales Distribution on Shopify
While Shopify provides essential tools for tracking sales, customers, and orders, it does not offer the Total Sales Distribution by Repeat Buyers feature. By harnessing the unique power of By the Numbers, you can unlock the percentage of total sales attributed to different buyer categories and their respective Average Order Values (AOV). These invaluable insights not only provide a clear picture of your sales but also empower you to strategize more effectively and drive your business forward.
Simply install the By the Numbers app, access the By the Numbers Dashboard, navigate to the Sales Distribution by Repeat Buyers Report, choose the report, and view and optimize your data. The app is designed to be user-friendly, making understanding your sales a breeze!
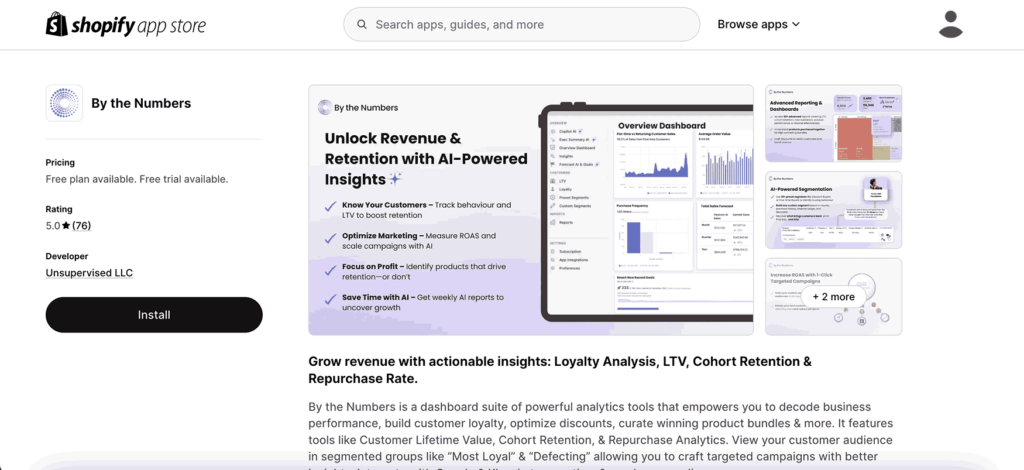
Step 1: Install the By the Numbers App
Getting started is easy and reliable. Simply visit the By the Numbers app page, click ‘Install’, and the installation process will begin. This comprehensive analytics and reporting tool is designed to track and analyze your store’s marketing and sales data, making it a secure and valuable addition to your Shopify store.
Step 2: Access the By the Numbers Dashboard and Navigate to the Sales Distribution by Repeat Buyers Report
After installing the app, enter By the Numbers from your Shopify dashboard (not separate account is needed). Now select Reports from the left Navigation menu. This is where you can find a wide range of data analysis features. From the ‘Sales’ section, select “Sales Distribution by Repeat Buyers”.
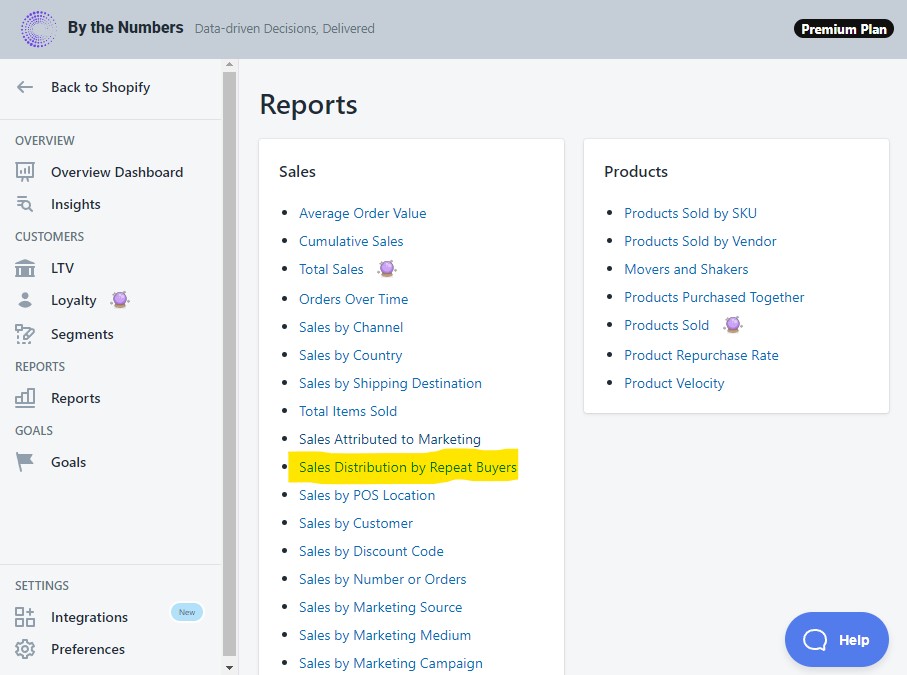
Step 3: Choose the "Sales Distribution by Repeat Buyers" report
From the Sales section, locate and select the “Sales Distribution by Repeat Buyers” report. This report breaks down your sales by the number of purchases each customer has made and display the AOV for each group.
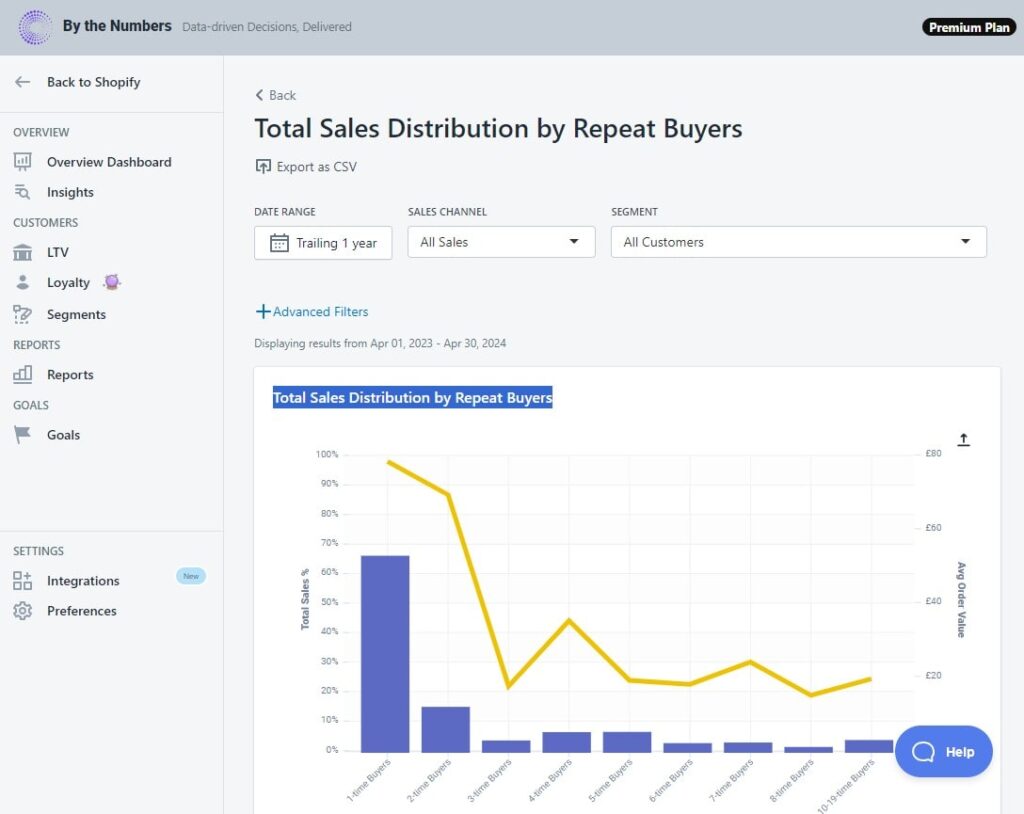
Step 4: View and Optimize your Total Sales Distribution by Repeat Buyers Data
After selecting the “Total Sales Distribution by Repeat Buyers” report, your last step is to simply decide on your analysis time window. Click “Date Range” to select from a range of time frames from “Trailing 2 Month”, “Trailing 1 Year” or all the way as far back as “Trailing 8 years”. You can now view and download your data in CSV format
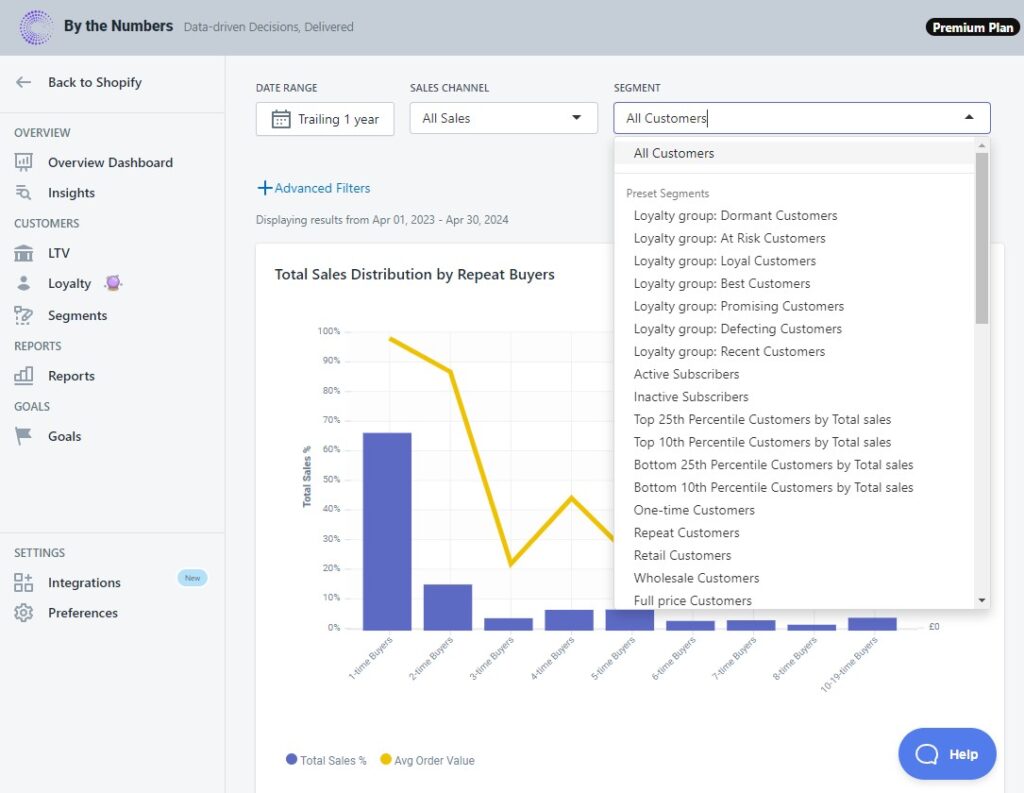
FEATURE HIGHLIGHT: Custom Segmentation of Orders Over Time
By the Numbers offers a premium feature, filtering by segment. Pick one of the pre-made segment groups that the app offers such as your customer’s loyalty (Best Customers, or your Dormant Customers) or choose who to address by segmenting according to their behavior (Retail Customers, Full Price Customers or Wholesale Customers…). If none of those fit your needs, create your own advanced segment filters and dive deep into your data.
Get a free demo by a Shopify data expert and see what all the fuss is about!
READY TO TAKE YOUR BUSINESS TO THE NEXT LEVEL?
Or get started with a Start A Free Trial
