Negatives are remembered more than positives.
You could do 100 things right but the 1 wrong thing is the what people remember.
This idea applies to your store.
Inventory Management
Imagine the customer wanting to purchase a product of yours but they found out it was out of stock.
It completely ruins their experience with you.
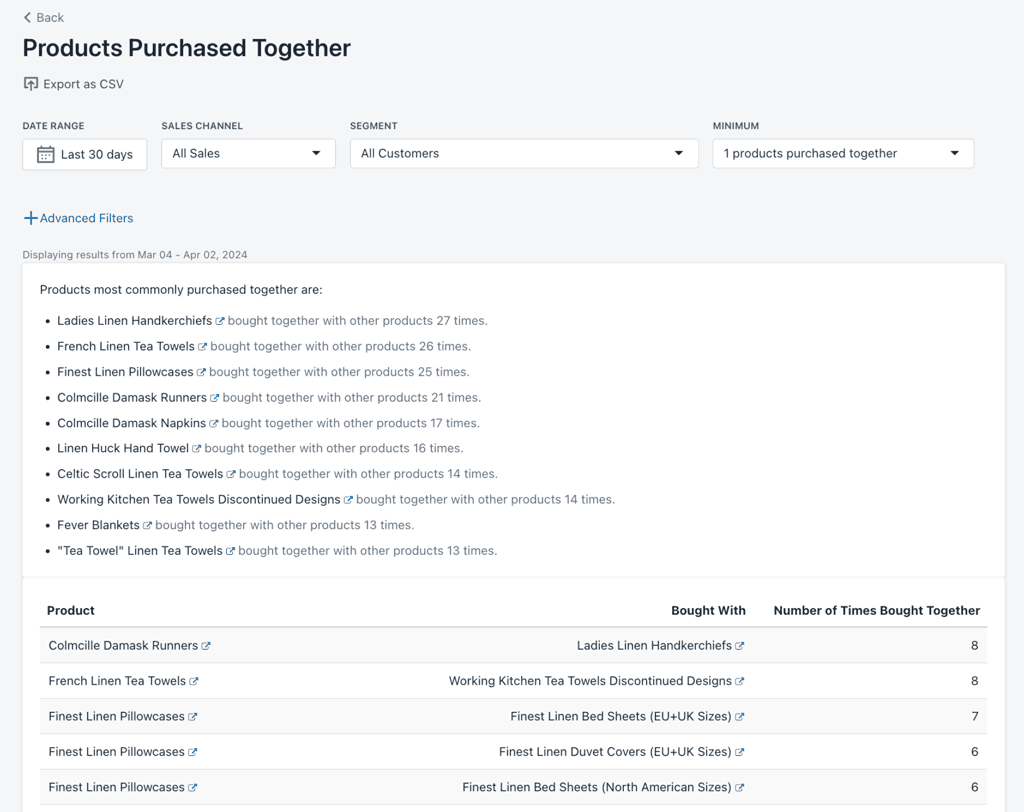
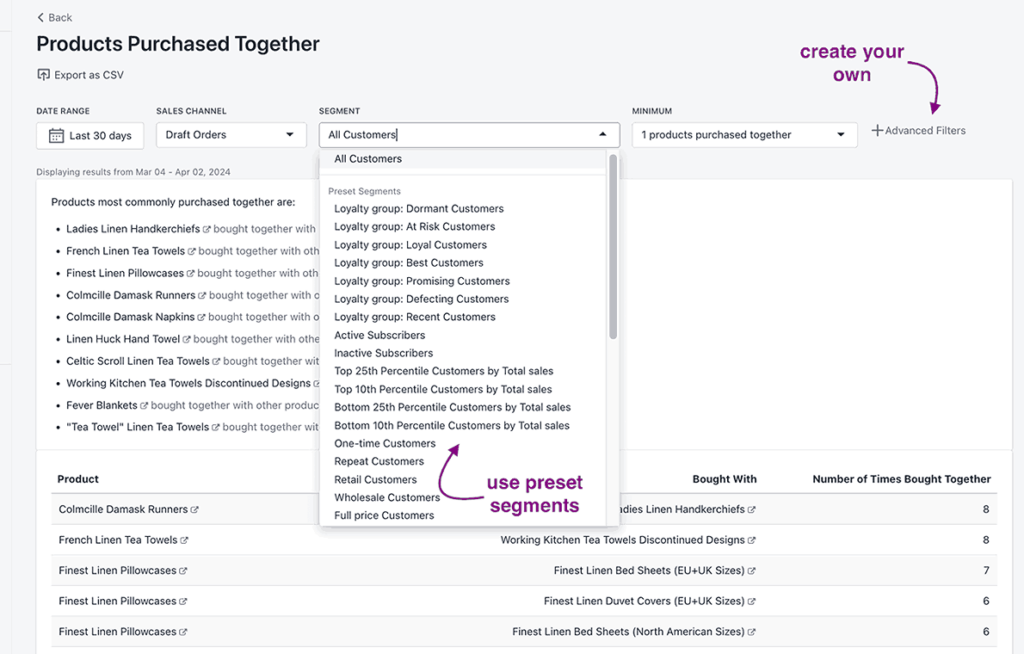
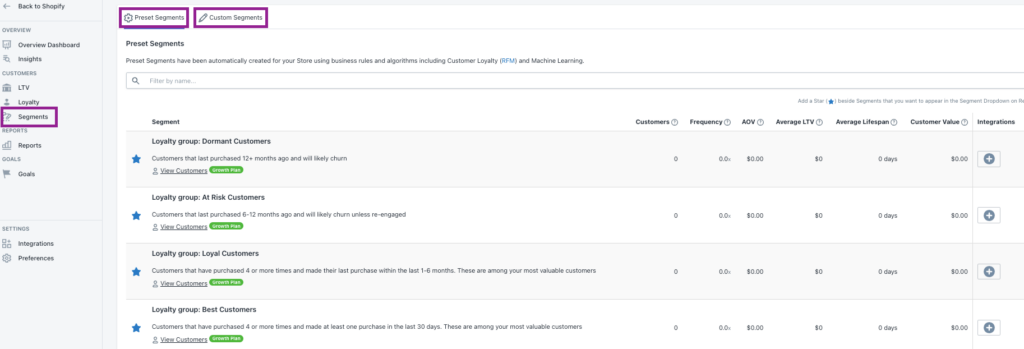
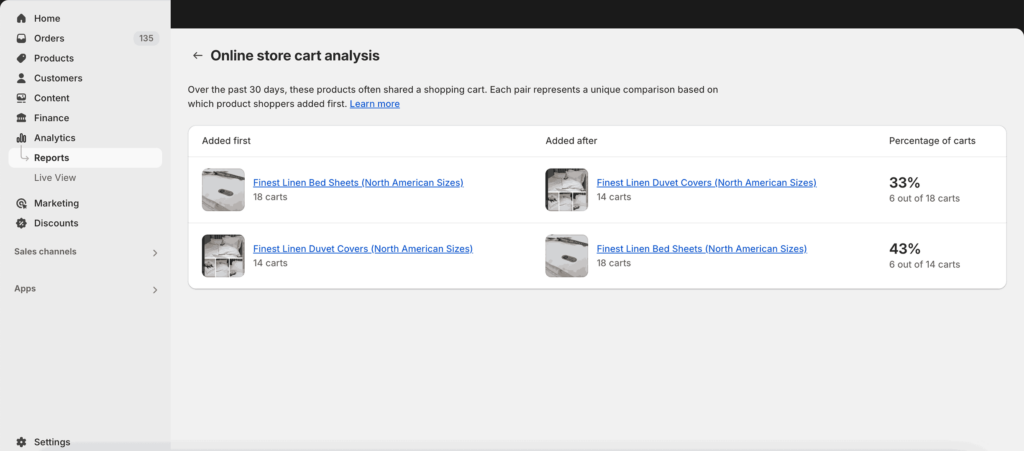
Understanding which products are bought together allows you to predict the demand of your products at each time of the year.
Let’s do an example.
If you own a cosmetic store and Valentine’s Day is coming up, you know it’s a big time for your store.
Let’s say your primers are your best sellers. You know what people buy with primer? Foundation.
Why make the customer go to another store to buy foundation, when you’ve already got it?
This won’t happen if you knew they’d look for foundation as well.
A report would show you that.
Product Placement
Let’s use our makeup example still.
Let’s say your customer is on the main page for the primer, looking at the benefits, the options, and the price.
There is then a section that’s below that says “This product pairs well with this foundation”
And shows the same foundation that the primer is frequently bought with.
You know what you do here for your customers? You create an effortless experience. They don’t even have to think. The product they were going to buy is already available for them to click.
You can even do this by placing the products side by side on the catalog page where all your products are shown.
Marketing
Let’s take one of the best ways to market to your audience: email marketing
If a customer recently bought a primer, you can send an email to them that campaigns the foundation.
You can talk about how they should get the foundation to perfect their look.
It’s a great yet overlooked way of gaining customer loyalty.
Knowing which products are bought together can also help you with sponsorships.
If you use an influencer to promote your products, you shouldn’t just give them the primer (your bestselling product) but the foundation too.
Since these two are always bought together, it encourages the potential buyer to buy more.
Conclusion
On Shopify, a frequently bought together report is essential for optimizing your Shopify store’s performance. This report shows better product recommendations, creates strategic upsells, and designs product bundles. By leveraging this information, you can increase sales and grow your business.