
How to Access Advertising Cost Reports (and Campaign Costs) on Shopify
By the Numbers is not just an analytics tool; it’s a powerful resource that can revolutionize your understanding of how advertising costs impact your campaigns.
Here’s a step-by-step guide on how to access these reports:
How to Access Multiple Advertising Costs Reports on By the Numbers
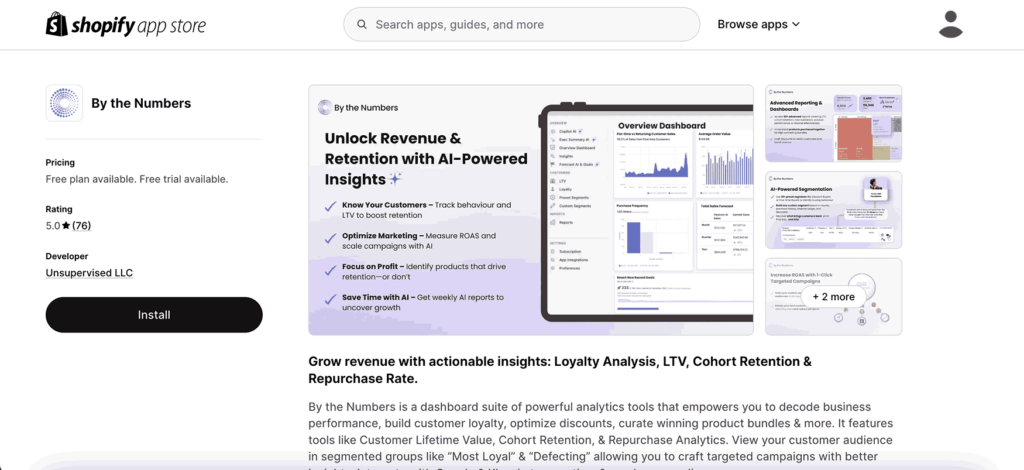
Step 1: Install the By the Numbers App
Visit the Shopify App Store and install By the Numbers.
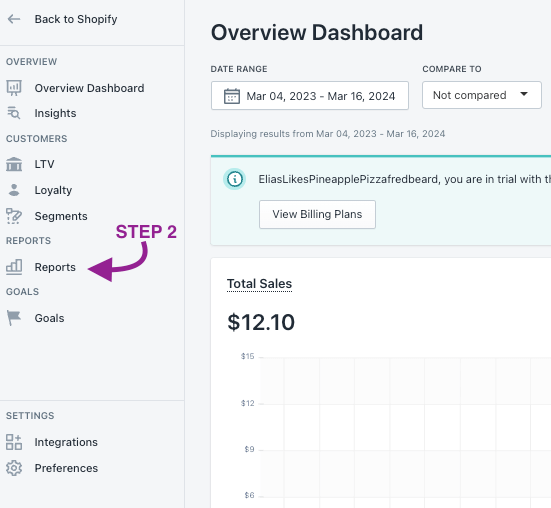
Step 2: Access the By the Numbers Dashboard and Navigate to the Reports Section
The Reports section can be located on the left-hand menu of BtN.
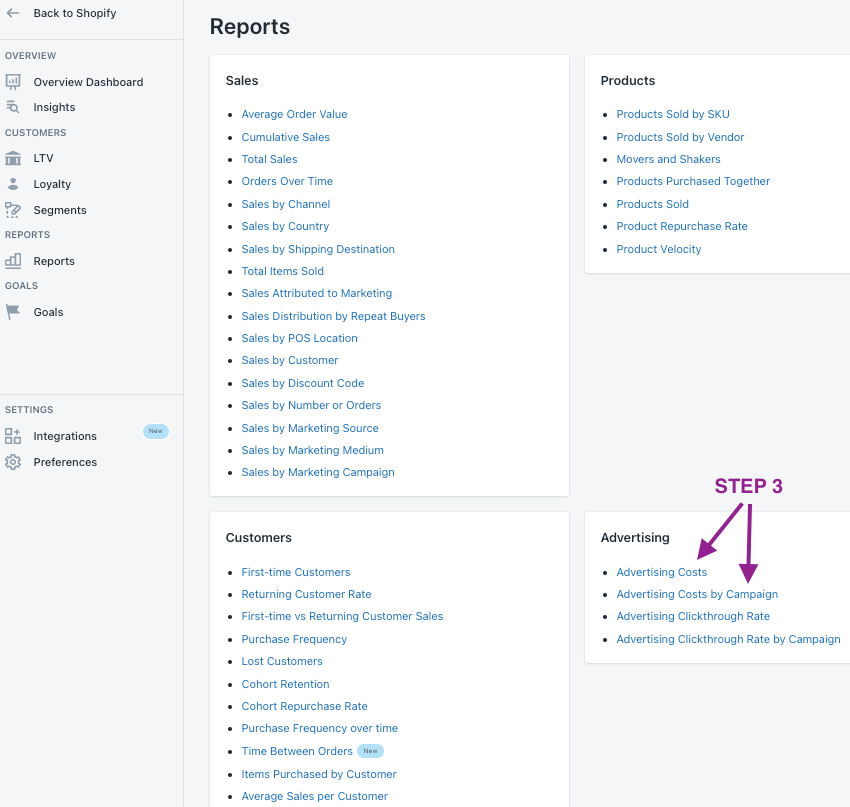
Step 3: Select the Advertising Costs or Advertising Costs by Campaign Report
Find the Advertising Costs or Advertising Costs by Campaign Reports in the Advertising section.
Here’s two images of what the reports include:
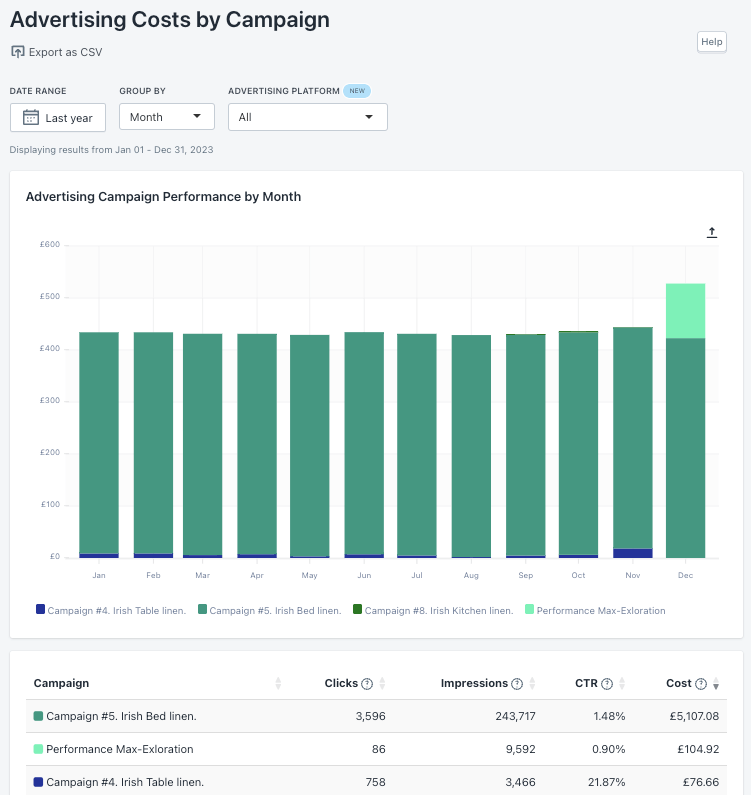
This report is interesting when diving deeper into acquisition costs. The metrics in BtN’s Advertising Costs and Advertising Costs by Campaign Reports, which are crucial for understanding the effectiveness of your advertising campaigns, include:
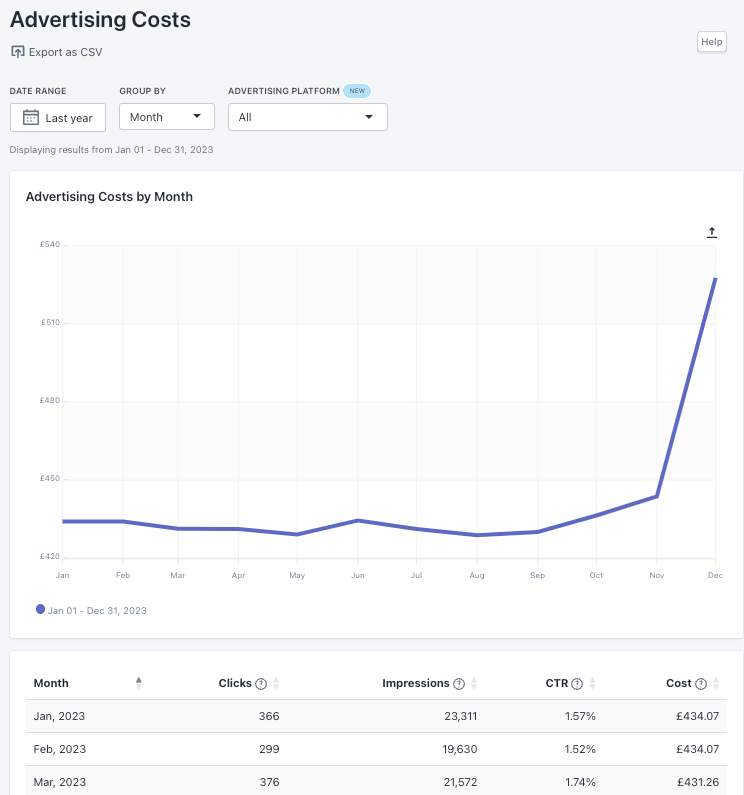
In the Advertising Costs report:
Month: The month for which the data is being displayed. Options include Today, Yesterday, Month to Date, Year to Date, etc.
In the Advertising Costs by Campaign:
Campaign: The identifier or name of the advertising campaign.
Group By: Aggregate the data by Day, Week, Month, or Year to view trends over different intervals.
Clicks: A click is counted when someone interacts with your ad, like clicking on a text ad’s blue headline or phone number.
Impressions: An impression is counted each time your ad is shown on a search result page or other site on the Google Network.
Clickthrough Rate (CTR):
Clickthrough rate (CTR) can gauge how well your keywords, ads, and free listings perform. It is the number of clicks that your ad receives divided by the number of times your ad is shown: clicks ÷ impressions = CTR. For example, if you had five clicks and 100 impressions, your CTR would be 5%.
Cost: The total cost of your cost-per-click (CPC) and cost-per-thousand impressions (CPM) costs during this period across ad campaigns.
The Advertising Costs and Advertising Costs by Campaign Reports in your dashboard provide a comprehensive visual representation of your advertising performance over a selected date range and interval. It’s designed to help you thoroughly analyze your advertising costs and engagement metrics.
By the Numbers offers a comprehensive view of your advertising performance, empowering you to track your ad spend, analyze your advertising strategy, and make informed, data-driven decisions.
Tracking your ad spend to attract more customers is always the smarter move. This is why you’ll find these reports interesting. Keep track of every advertising platform and analyze your advertising strategy performance.
Benefits of using By the Numbers to access your Advertising Costs or Advertising Costs by Campaign Report
By the Numbers offers a comprehensive view of your advertising performance, empowering you to track your ad spend, analyze your advertising strategy, and make informed, data-driven decisions.
Tracking your ad spend to attract more customers is always the smarter move. This is why you’ll find these reports interesting. Keep track of every advertising platform and analyze your advertising strategy performance.
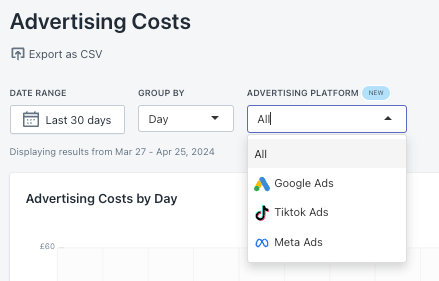
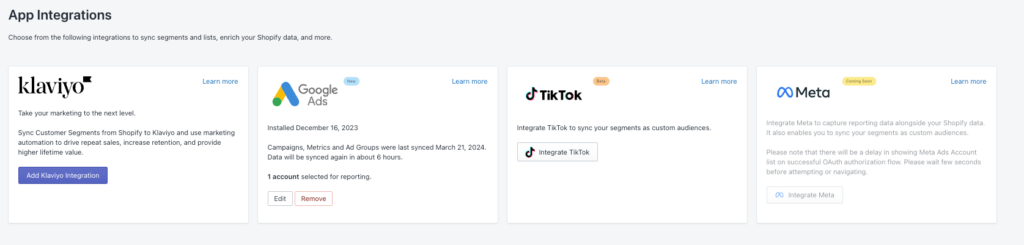
By the Numbers integrates easily with popular advertising platforms such as Google Ads, Tiktok Ads, and Meta Ads. This allows you to filter both reports by your preferred platform, making your analysis more targeted and effective.
Play with BtN’s integrations and boost sales!
1- Once logged in to By the Numbers, access Integrations. You will locate it in the Settings Section.
2- Choose the integration you want to incorporate and follow the instructions provided.
Having this type of data along with other valuable reports in the same platform is very convenient and can boost efficiency in every store. Start making data-driven decisions with By the Numbers, and you’ll see a significant difference in the outcome. Access the Advertising Costs and Advertising Costs by Campaign Reports and improve your campaign performance today.
Book a time with us if you need further assistance or want a free one-to-one demo with one of our data experts. We’re here to help you get the most out of By the Numbers.
Get a free demo by a Shopify data expert and see what all the fuss is about!
READY TO TAKE YOUR BUSINESS TO THE NEXT LEVEL?
Or get started with a Start A Free Trial
