How to Access Cohort Repurchase Rate Report on Shopify
Understanding your customer retention on Shopify can be challenging as the platform doesn’t provide this information. That’s By the Numbers comes in, offering a more accurate and comprehensive solution. However, if you prefer to work with Shopify’s data, we’ve provided it along with simple calculations.
How to Access the Cohort Repurchase Rate Report on By the Numbers
Step 1: Install the By the Numbers App
Getting started with By the Numbers is a breeze. Simply head to the Shopify App Store and install the app. You’ll gain access to a wealth of insightful data about your store and customers that Shopify doesn’t provide. This user-friendly interface empowers you, the Shopify store owner, with the tools and information you need to succeed.

Step 2: Access the By the Numbers Dashboard and Navigate to the Reports Section
The Reports section is on the left-hand side of the menu.

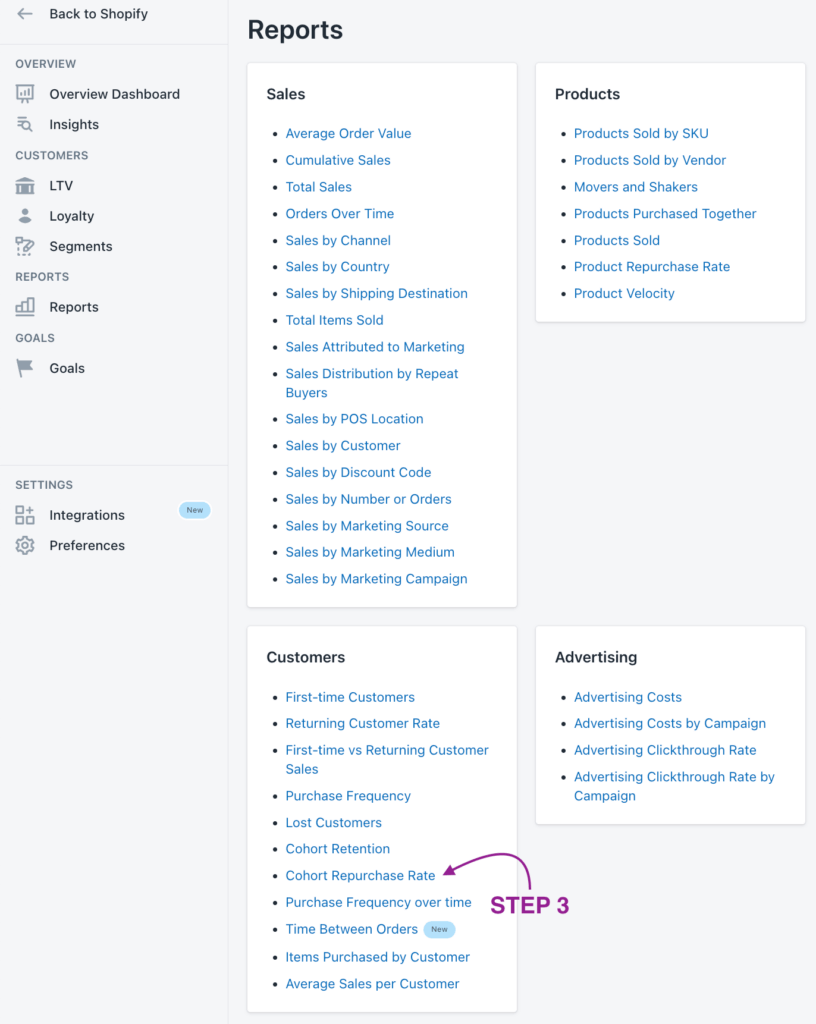
STEP 3: Select the Cohort Repurchase Rate Report
In the Customer Section, find the Cohort Repurchase Rate Report.
The following screenshot will show you what By the Numbers’ Cohort Repurchase Rate Report looks like and all the data it brings:
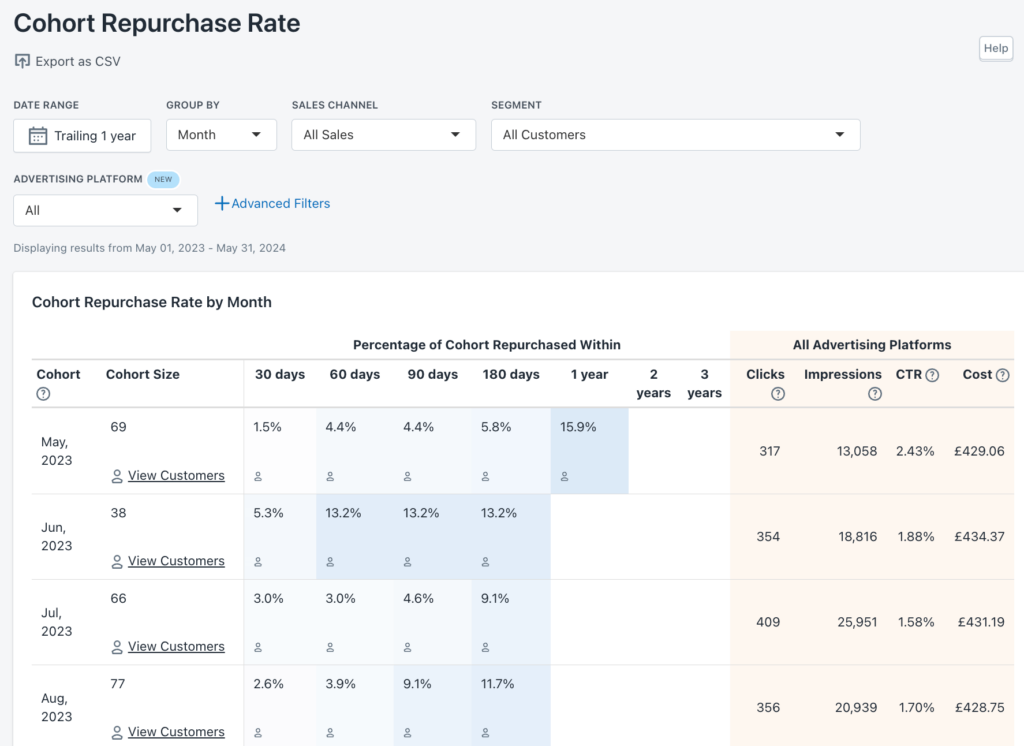
In this example, 44 customers placed their first order in April 2023. Of those customers, 2.3% placed a second order within 30 days of the first order. This means that within the first 30 days, 2.3% of your customers made a repeat purchase. You can use this information to evaluate the effectiveness of your customer retention strategies.
By the Numbers defines a ‘repurchase’ as any order placed a day after the previous order. This means that if a customer places different orders within the same day, they won’t be considered repurchases. It is important to keep this distinction in mind when interpreting the data.
Each period is a complete retrospective. This implies that data will only show up when 30 days have passed. By no means will partial data be shown.
When analyzing the Repurchase Rate, you will see that the longer the interval, the higher the Repurchase Rate. That is to say:
360 days RR > 180 days RR > 90 days RR > 60 days RR > 30 days RR
When RR is high, it usually means a strong Product/Market fit, which helps you figure out how much to invest in customer acquisition. For instance, if you see a high repurchase rate for a specific product, it might be a sign that the product is widespread, and you should consider investing more in its marketing. This is where the app integrations, particularly the Google Ads one, come in handy.
- Clicks: The number of times users interact with your ad.
- Impressions: The instances in which your ad is displayed on the Google Network.
- Clickthrough Rate (CTR): The efficiency of your ad is determined by dividing clicks by impressions. For instance, 5 out of 100 impressions results in a 5% CTR.
- Cost: The combined expenditure of your Cost-Per-Click (CPC) and Cost-Per-Thousand Impressions (CPM) across various ad campaigns.
With these metrics, you’ll have a comprehensive view of the efficiency of your marketing strategies and activities.
How to Calculate Repurchase Rate on Shopify
Access your Shopify store and find the number of customers who placed an order in a specific time frame.
1- Click on Analytics > Reports
2- Click on or search for Customers Over Time report
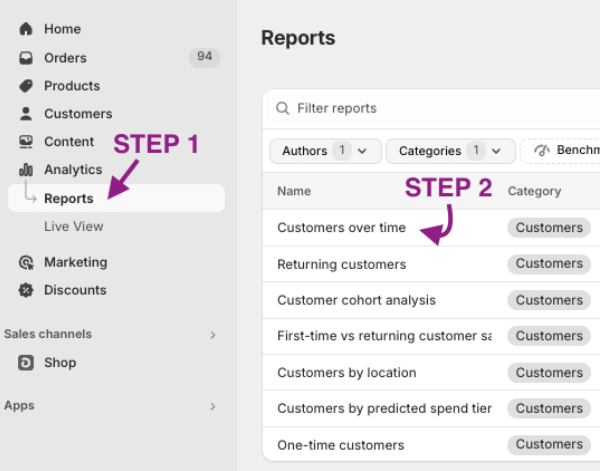
This is Shopify’s Customers Over Time report:
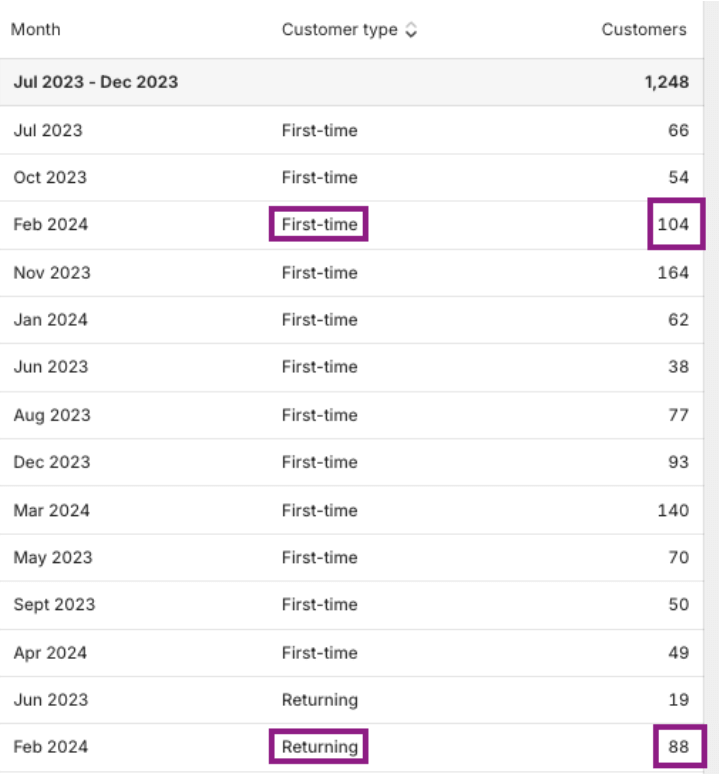
3- Find the time interval you are interested in and look at First-time and Returning Customers.
4- Divide the repeat customers by the total customers and multiply it by 100 to get your percentage.
As you must have noticed, Shopify requires you to do the calculation itself, while By the Numbers offers not only that but also a wide range of insightful data about your customers’ returning habits.
Also, this report needs to be customizable and specific enough, unlike By the Numbers. Would you like to know if, when, and how many customers who bought a particular product in summer returned for more? Would you like to address them personally through channels like Klaviyo, Google Ads, TikTok Ads, and Meta?
Keep reading. You might enjoy what you will bump into:
Benefits of using By the Numbers to access your Cohort Repurchase Report.
The By the Numbers report is superior. Shopify wants you to calculate the percentage yourself, while BtN provides it straightforwardly along with many other high-end features, empowering you with comprehensive insights. This thorough understanding of customer retention can give you the confidence to make informed decisions about your business strategy.
Let’s start with customization. Everyone knows it is key to segment your audience and address them personally, specifically. BtN’s report is fully customizable in terms of date ranges, channels, and customer segments. This flexibility allows you to explore certain customer groups and find strategic ways to lead to upsells and plan upgrades, putting you in control of your customer engagement strategies. With By the Numbers, you’re not just accessing data but shaping your business strategy.
You’ll have access to preset and custom segments and an effortless method to retarget these audiences via platforms like Klaviyo, Google Ads, TikTok Ads, and Meta Ads. By the way, if you are using ads, BtN will facilitate the integration of this data into your reports. These app integrations can significantly enhance your customer engagement strategies by allowing you to target specific customer groups and personalize your marketing messages.
Custom Segmentation
By the Numbers has already created some functional segments, but you always have the chance to create your own.
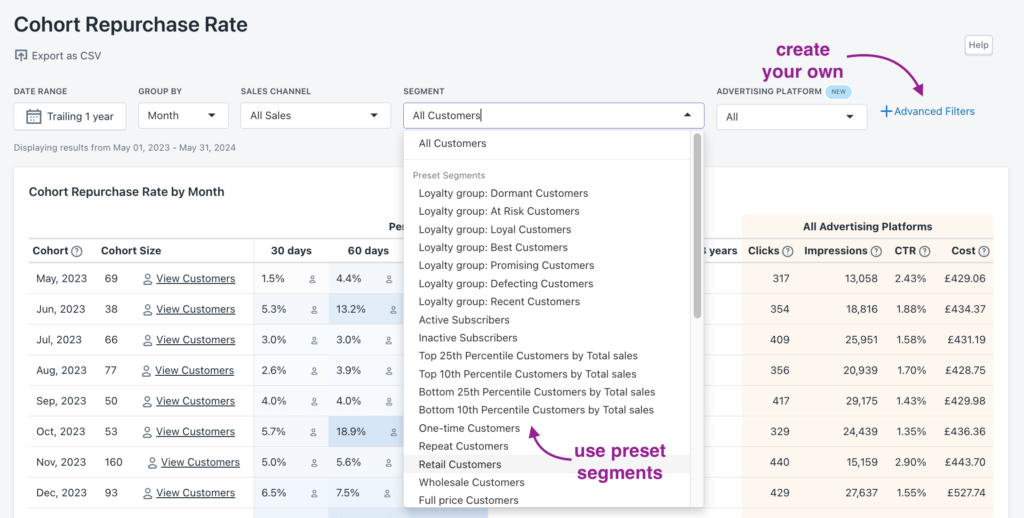
Here’s the quickest way to find the preset segments and create your own:
1- Find the Segments option in the left-hand menu once logged in to By the Numbers. You’ll see two tabs: Preset Segments and Custom Segments.
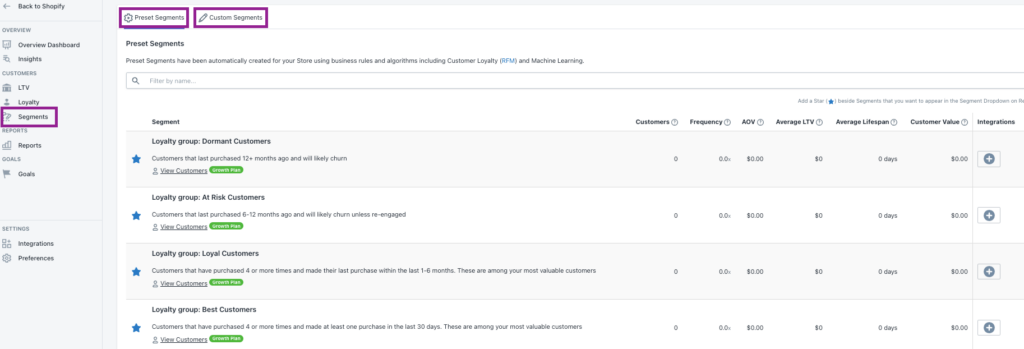
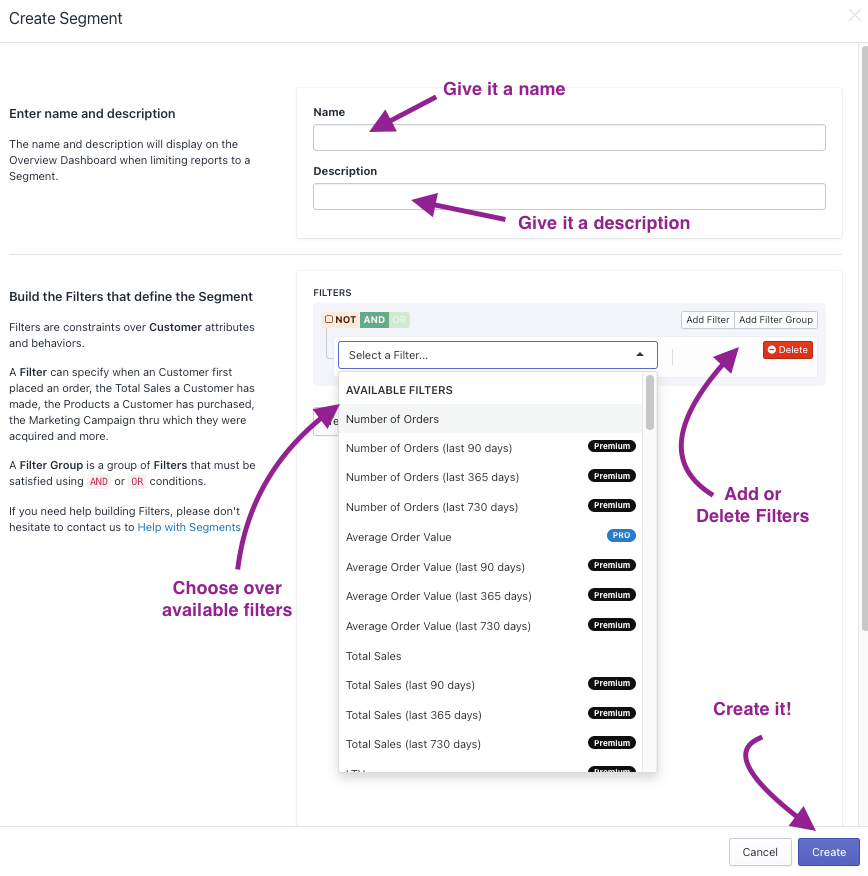
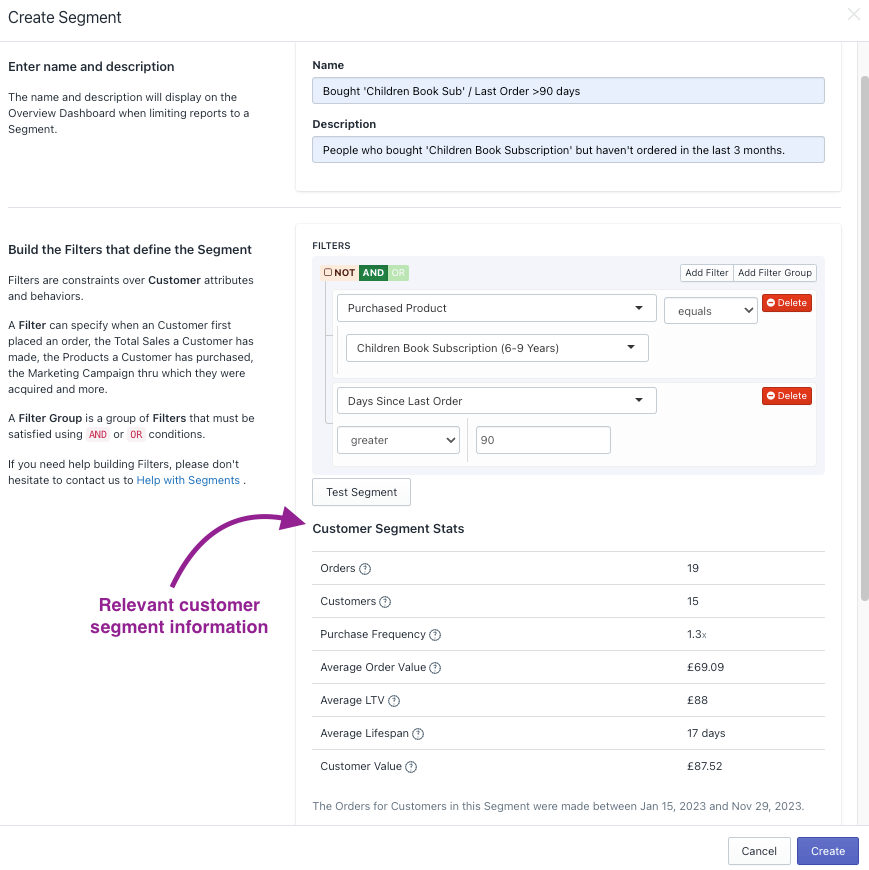
2—To create custom segments, find the button at the top right corner and hit ‘Create Segment.’ A new window will pop up, and you’ll find all the filters to segment your audience.
Testing your segment once you’ve picked the filters you like is very important. This will ensure it is perfectly set and give you insights about the customer segment you want to create.
By the Numbers App Integrations
Let’s jump into the other feature that is attracting more and more curious store owners. App Integrations are a big thing in By the Numbers. We believe the ability to retarget customer groups specifically can be a game changer. Determine the customers at risk of churning and get them involved in a win-back campaign through Klaviyo, Google Ads, TikTok Ads and Meta. That’s just one strategy that comes to mind, but you’ll have many options; the sky’s the limit. You can also use the data from those platforms in your reports.
Play with BtN’s integrations and boost sales!
1- Once logged in to By the Numbers, find Integrations in the left-hand menu of your screen within the Settings section.
2- Pick the integration you wish to incorporate and follow the guidelines.
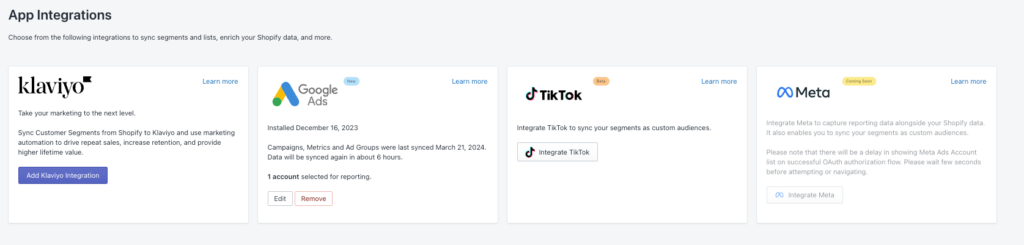
By the Numbers facilitates integrations with Klaviyo, Google Ads, TikTok, and Meta, enabling targeted engagement with customers across your channel of choice. Furthermore, a key capability of these integrations is their ability to compile all your data from Klaviyo, Google Ads, Meta, and TikTok Ads into diverse reports. This feature significantly expands your analysis capabilities beyond simple retargeting efforts.
By the Numbers offers seamless integration with platforms like Klaviyo, Google Ads, TikTok, and Meta. This allows customer interactions through your preferred channels and uses these platforms’ data in your reports.
Get a free demo by a Shopify data expert and see what all the fuss is about!
READY TO TAKE YOUR BUSINESS TO THE NEXT LEVEL?
Or get started with a Start A Free Trial