The e-commerce industry is now worth $6.33 trillion (2024). Thriving in this industry is what every store owner wants. Thriving in this industry means unlocking countless opportunities. This is why the RFM Analysis is important.
Over the next few years, the industry is expected to grow at 8.8% each year. At this rate, the growth could increase. You have to grow with the industry to keep up with it.
More growth means more customers. More customers means understanding your customers is now even more critical. Failure to do so could mean the failure of your store. Asking yourself questions such as “What is RFM Analysis?” will be needed to scale your store.
The Benefits of RFM Analysis and How it Grows Your Store
Here’s what happens if you don’t understand your customers:
- You target the wrong customers with your email marketing
- You risk losing your best customers who frequently buy from your store
- You jeopardize your growth and fail to reach the customers who would love your products
An RFM analysis can help you better communicate with your customers based on their actions.
How can you personalize your product recommendation? Which marketing channels are most effective for your customers? How can you optimize your pricing strategies?
These are just a few questions the RFM Analysis can help answer.
The following guide explains the RFM Analysis and how it helps your business. This tool can prevent unwanted scenarios and ensure smoother sailing for your store.
Let’s begin…
What is an RFM Analysis?
Understanding your customers’ behaviour means understanding how to operate your business.
An RFM Analysis is a scoring system that segments and understands customers effectively.
This analysis will organize and analyze your customers based on 3 categories:
- Recency: When was the last time the customer bought from the store?
- Frequency: How many orders have they made?
- Monetary: How much have they spent?
First, customers are organized into segments based on their Recency and Frequency. The matrix below shows the result.

As you can see, there are 7 groups that customers can be sorted into:
- Best Customers: Customers who have been grouped into this category have purchased from the store within the last 30 days and have made 4 or more orders
- Loyal Customers: Customers who are grouped here have last ordered from the store 1-6 months ago and made 4 or more orders like the Best Customers
- Promising Customers: Customers who are here have only made 2-3 orders so far and have been at your store anytime within the last 6 months
- Recent Customers: Customers who have recently ordered from your store within the last 30 days (like the Best Customers) but have only made 1 order.
- Defecting Customers: Customers who ordered 1-6 months ago but only made 1 order.
- At-Risk Customers: Customers at your store 6-12 months ago.
- Dormant Customers: Customers who were at your store over 12 months ago.
These are the most important segments to analyze, as they can generate the largest ROI when you invest in learning about them.
To make sure you understand, let’s do 2 examples:
Customer A has made 2 orders; last did so 4 months ago. Looking at the matrix above, having 2-3 orders and last ordering 1-6 months ago puts them in the Promising Customers category.
Customer B has made 6 purchases and last ordered 2 weeks ago. Customers who have made 4 or more orders and ordered within the last 30 days will be placed in the Best Customers Category.
Once these customers are sorted into groups, we score their monetary value based on this group’s Average Order Value, LTV, Total Sales, and unrealized sales.
By the Numbers
Empower your business with our Shopify Data Driven App
- ✔ Know Your Audience Behavior
- ✔ Deep Customer Segmentation
- ✔ Retarget With Integrations
- ✔ All The KPIs & Reports You Need
Why this Analysis Matters
As we stated before, the e-commerce industry is rapidly growing. This means that more customers are now surfing Shopify. As more customers surf through your store, more customers now vary in experience and desire.
With all this subjectivity, there needs to be an objective way to analyze these customers, which is why the RFM analysis is crucial.
Why is that the case if you start losing some of your most loyal customers? You can’t find out if you don’t understand your customers. Studying your loyal customers to create a better experience is important, but you can’t do that if you don’t know why they love buying from your store.
The RFM Analysis provides a fast, useful way to segment your customers, which lets you make better and more accurate customer analyses.
Using Recency, Frequency and Monetary as your three areas for scoring your customers is also a fantastic way to go:
- Recency helps provide insight into customer engagement. Which customers are active in your business? Which customers need to be contacted to win them back?
- Frequency can show you opportunities to cross-sell. Which customers can we offer product bundles that are highly likely to convert into sales?
- Monetary can show you where your most profitable customers are. How can we benefit these customers and increase their Customer LTV?
Recency, Frequency, and Monetary are not abstract concepts in RFM Analysis. They are practical tools that can revolutionize your understanding of your customers. Having an objective way to analyze your customers makes the segmentation process seamless. You can use these segments to further analyze sales patterns, advertising interactions, and much more.
How to Use the RFM Analysis to Benefit Your Business
Now that you’ve seen how the RFM Analysis works and why it’s an important tool to understand let’s dive deeper into aspects of the business that can benefit you.
Once you have the segments from your RFM analysis, you can answer many questions to help your business grow.
90% of your questions that require an analysis can be answered with an analytics app like By the Numbers
Here are 5 aspects of your business where the RFM Analysis can help uncover insights and drive decisions.
- Targeted Marketing – Improve how you communicate with customers
- How do my Loyal Customers respond to my Google Ad campaigns?
- Which marketing channel should we allocate more of our budget to target our Best Customers?
- Product Recommendation – Tailor products to your customers
- What do the purchasing patterns of our Best Customers look like?
- What products are frequently bought together amongst those that frequently visit?
- How do we pair the right products with the right customer to create a better user experience?
- Inventory Management – Have the right products ready to go
- Based on recent sales, which items should be prioritized for restocking due to high demand?
- Which products were highly associated with this segment from those who last visited the store a while ago?
- Churn Prediction – Decrease your churn and optimize the customer experience
- Which customers indicate a high likelihood of churning, and what does their customer journey look like?
- Is there a correlation between products and At-Risk Customers? How about for Marketing Channels?
- Customer Retention – Keep your Best and Loyal customers happy and grow these segments. Also bring back your Dormant customers with a win-back customer campaign.
- Which initiatives have been associated with our Loyal Customers?
- Which behaviours are associated with our Best Customers (i.e. once the customer has made 3 separate orders, are they likely to visit the store more frequently)?
The Issue With Using Shopify
Let’s walk you through how to do this whole process on your own manually:
- Collect the data of all your customers from your Shopify store
- Export this data onto an Excel or Google Sheets document
- Organise your data set to group customers first based on their recency
- Then, organize your data set to further group your customers based on their frequency
- After creating the groups, analyze the monetary value of each customer in each group
- Calculate the LTV of each customer
- After this, for each group, calculate their average LTV to see their monetary value.
This process will not only be a lot of work but also take up time. As your customer base grows, so will the time it takes to analyze all customers properly. There’s also room for human error using this method.
It is also worth mentioning that you will have to update your customer base manually using this method.
This method takes too much time and can cost an insurmountable amount of cash (conducting a data analysis could cost up to $100,000 a year).
Shopify’s reports are limited, and detailed reports cannot be provided. This is why an app like By the Numbers proves itself helpful. Having an automated analysis that offers real-time updates is beneficial to your store. You can then use these segments created for further analysis.
It also helps that By the Numbers offers a data analytics service at a fraction of the cost of other options.
Here’s an example of how you can conduct further analysis on our app. If we were to answer the question, “What is the Time Between Orders for our Best Customers?” using the RFM Analysis, we could access the report Time Between Orders and change the segment to “Best Customers.” All Segments from the analysis are premade for you and receive real-time updates. We then conduct an accurate analysis.
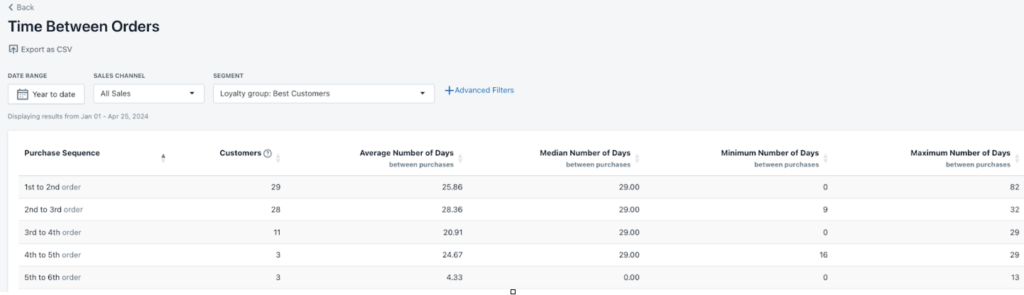
As you can see, the time between orders drastically decreases from the 5th to the 6th order. This is only one of the many ways By The Numbers can help your store.
By the Numbers
Empower your business with our Shopify Data Driven App
- ✔ Know Your Audience Behavior
- ✔ Deep Customer Segmentation
- ✔ Retarget With Integrations
- ✔ All The KPIs & Reports You Need