What is a Shopify Sales Report by Collection?
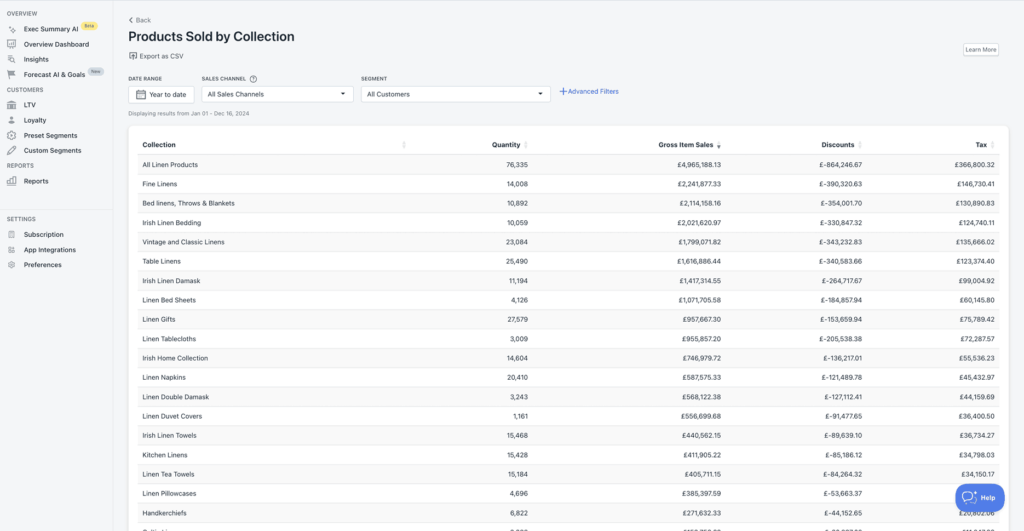
A Shopify Sales Report by Collection takes all your products and puts them into groups. This allows you to see how each section of your store is performing.
For Example:
Let’s use a linen store. We can use product groups such as Table Linen, and Linen Bed Sheets.
A Shopify Sales By Collection Report shows the sales from each product group.
Product Group Total Sales
Table Linen = $400
Linen Bed Sheets = $700
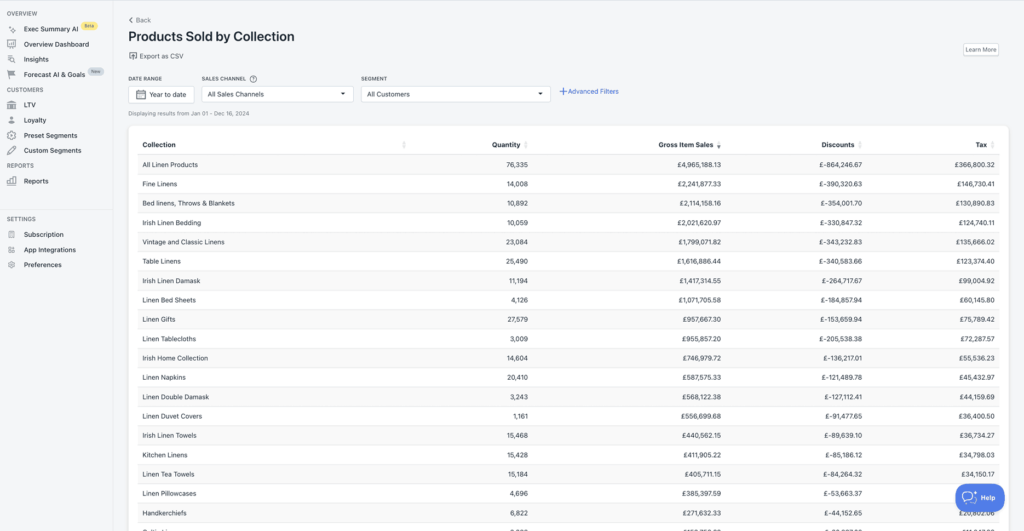
Reports like this one let you see which product groups are growing your store, and which product groups could use some help. What’s important is that this report can be detailed and customizable, allowing you to:
- Adjust the Date: This allows you to measure the performance of your products over whatever time period you want
- Choose the Sales Channel: This allows you to see which channel is the strongest and weakest.
- Filter by Customer Segments: This allows you to see how a specific group of customers are performing
An example of a report that can offer this can be seen below
How You Can Use a Sales Report by Collection to Scale
What makes this report so special is that you’re able to identify the parts of your store that are underperforming.
Store owners will go through periods where sales are generally down. This is normal.
What’s not normal is not knowing where the source of your decrease is coming from. Is it a general decrease in sales? Or is there a section where one place isn’t performing well? This report tells you that
Customer Knowledge
In this Report, you’re able to adjust the report by filtering by segment
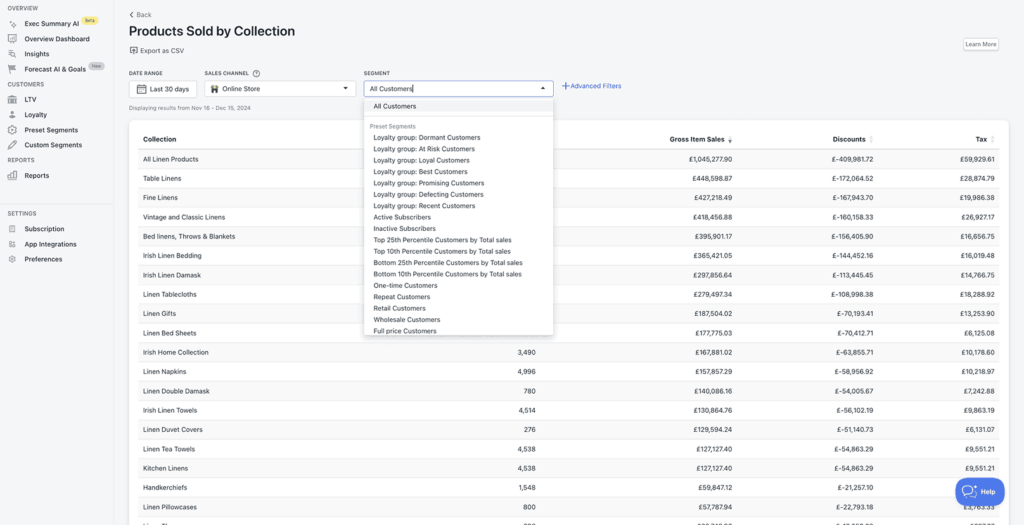
You can choose if you want to filter by a preset segment, or by a custom segment that you made (you’ll learn how to do this later)
It’s important to filter by customer segments as it shows a clearer picture of what’s happening in your business. It answers questions like:
- For my Loyal Customers, what are the top 3 best performing product groups? Are they always the top three groups throughout the year? With our reports, you’ll see the top performing groups for any time period, whether its for the year or for the last 30 days.
- What do my top customers like? With a segments filter, you can see which products your most loyal customers always buy
- What Product Groups are common with my At-Risk customers? This could mean that this product group could be defecting customers.
- Which group has been underperforming? This report could show you a group of products you need to focus on improving or even consider dropping from your store all together.
The one thing that many store owners don’t do properly, is understand customers based on characteristics. It’s important to understand each group of customers as each of them interact differently to your store.
Product Performance
As this is a report showing you how each group of products are doing, it’s clear to see that this report can provide you many answers to questions such as:
- Pricing Strategies: People get confused sometimes and think that discounts will solve all the problems for sales. While they help, sometimes you may be pricing too low. This report will give you an idea on your pricing performance
- Product Launches and Group Trends: When you launch products, you can look to see:
- If your new products are performing well.
- If other groups are performing well with your product launch. This is a sign of a potential upsell/product bundle opportunity.
- If two products are closely related in terms of performance. You could align product launches in these categories at the same time.
- Marketing Campaign Success: This is one of the reports that can help you see if your marketing campaign was a success as you can track the sales of the products.
The one issue that store owners have is clarity. A lot of times, store owners blindly take their shots and hope to hit their mark, only to realize they’ve been aiming in the wrong direction the whole time.
Many store owners feel stressed about meeting their targets. However, this is just because they lack the knowledge to actually meet their target. Reports such as this one from By the Numbers gives that clarity to help them make better decisions.

By the Numbers
Empower your business with our Shopify Data Driven App

- ✔ Know Your Audience Behavior
- ✔ Deep Customer Segmentation
- ✔ Retarget With Integrations
- ✔ All The KPIs & Reports You Need
Why This Report is Important
A Shopify Sales Report by Collection is extremely detailed. It’s also a report Shopify doesn’t have.
Shopify Reports are limited in terms of data. Usually you can’t see past 30 days, and you can’t filter based on sales channel.
You also don’t have the ability to look at different customer groups. This makes analyzing not only harder, but much more costly
This is why it’s important to have an analytics app that has detailed reports like this one which solves:
- Inventory Mismanagement:
A big topic amongst store owners. Speed is key. That means you need to know what product are still in stock. If you don’t, it creates a negative experience in your customer since they see something they want to buy, only to be disappointed as it isn’t available. - Inefficient Business Processes:
We want the stores we work with to operate efficiently. Efficiency means knowing where to allocate your funds. Looking at the inventory example from above, you may not realize you’re overstocking on your items. This means missing opportunities on potential sales. However, this report helps you avoid this. - Competitive Disadvantage:
To put it simply, the top store owners know how each of their product groups are performing which allows them to be efficient. There is a knowledge gap that exists that you can easily close. - Your Growth is Limited:
Especially without a segment filter. You won’t be able to see what your customers are actually into and take advantage of that.
The most frustrating thing about all these problems is that they’re completely avoidable. The stores that we work with have seen dramatic growth just because they’ve used reports like this to understand their company better.

By the Numbers
Empower your business with our Shopify Data Driven App

- ✔ Know Your Audience Behavior
- ✔ Deep Customer Segmentation
- ✔ Retarget With Integrations
- ✔ All The KPIs & Reports You Need
How to Access The Shopify Sales Report by Collection
Step 1: Install the By the Numbers App
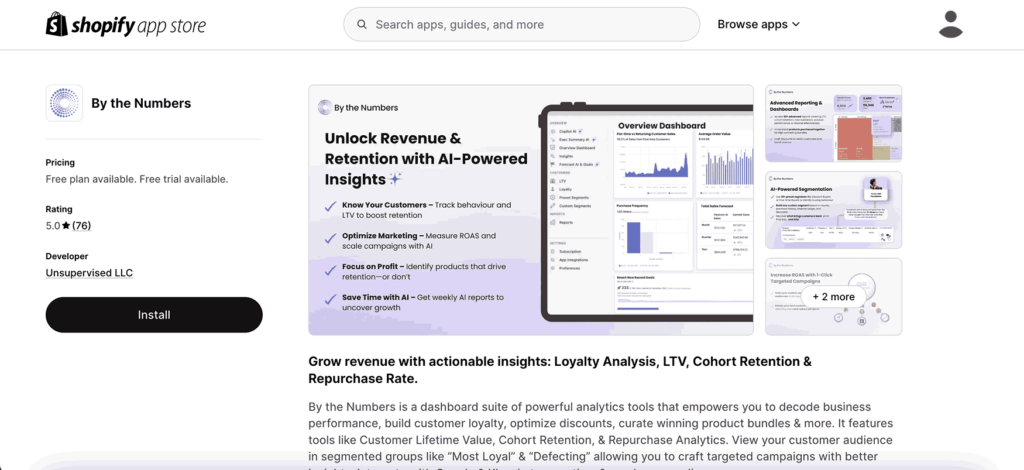
Step 2: Access the By the Numbers Dashboard and Navigate to the Reports Section
You’ll find the Reports section on the left-hand side of the menu.
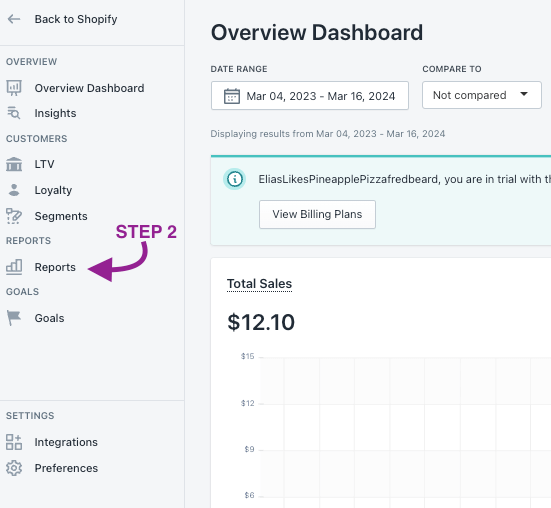
STEP 3: Select the Products Sold by Collections Report
This is on the right side under “Products”

How to Create Custom Segments
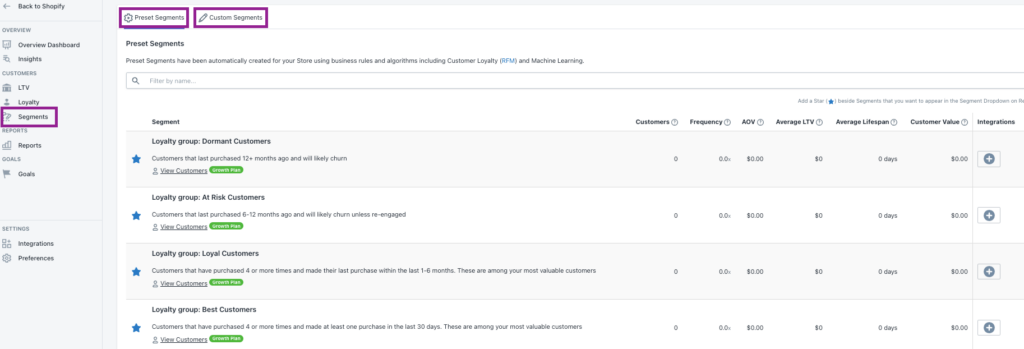
With By the Numbers, you can leverage various preset segments and create custom segments of your audience.
Click on the Advanced Filters button at the top of the report on the far right
If you want to see all the preset segments and create custom ones:
1 – Select the Segments option from the left-hand menu to explore all the Preset Segments and Custom Segments tab.
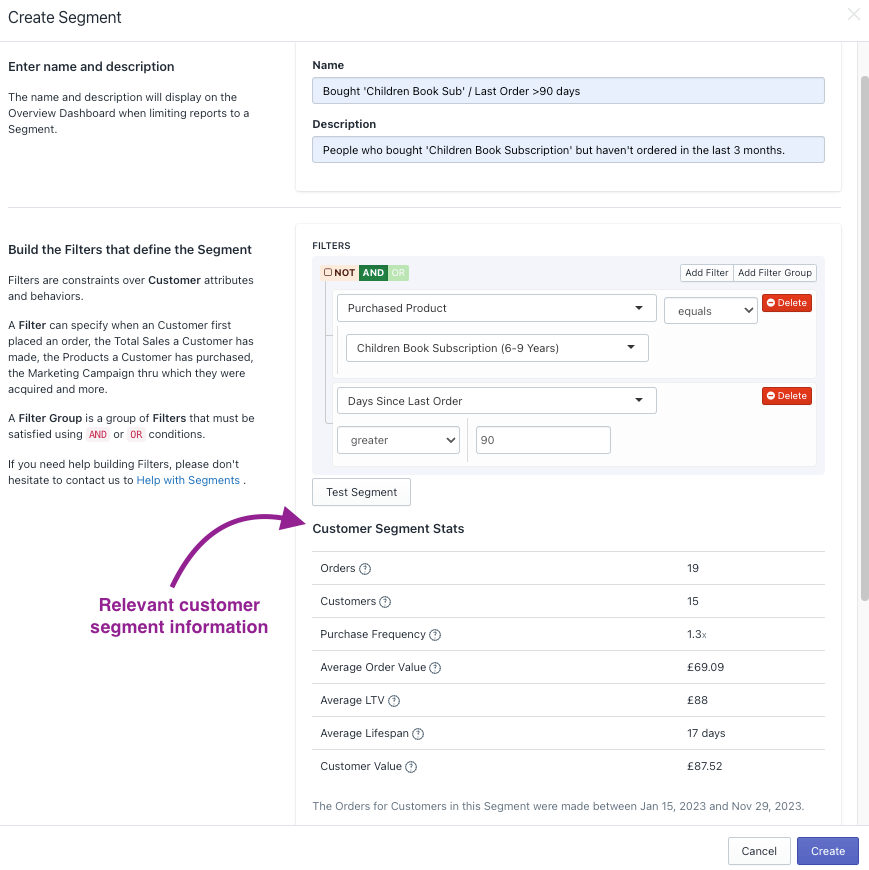
2 – If you want to create a custom segment, make sure to choose the filters you want to apply.
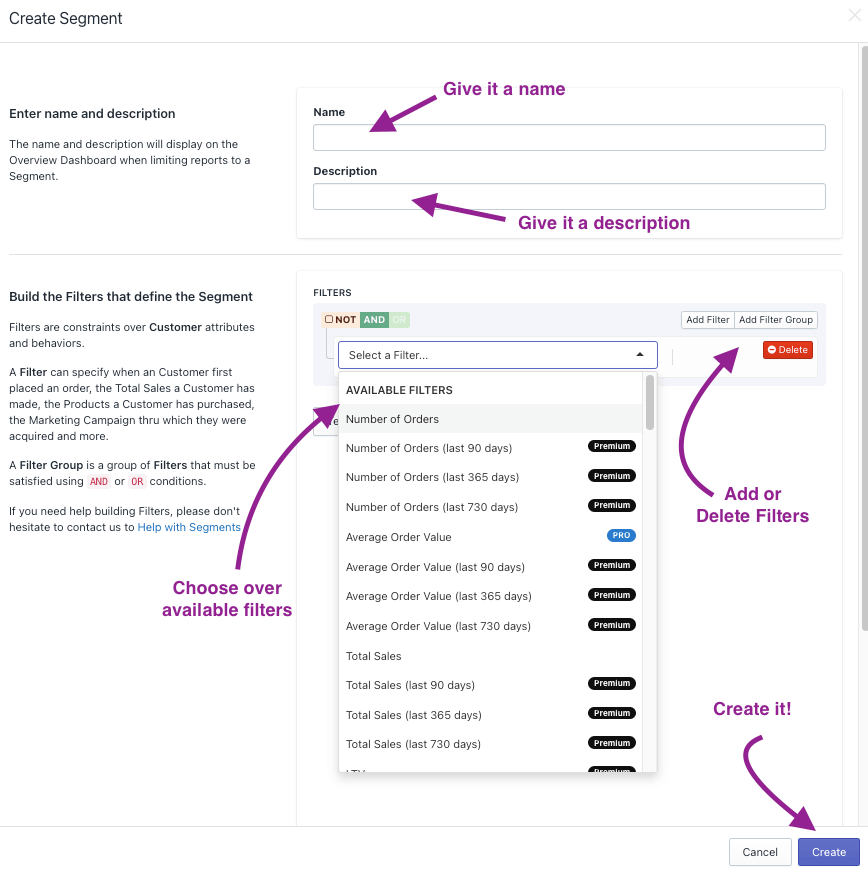
Remember to click “Test Segment” once you’ve selected the desired filters. This step ensures your filters are properly configured and offers crucial data about your customer segment.
You can also take these custom segments you’ve made on By The Numbers and integrate them on different platforms
Click on Integrations on the left hand menu (under Settings), and choose which platform you’d like to integrate your custom segments to as shown below
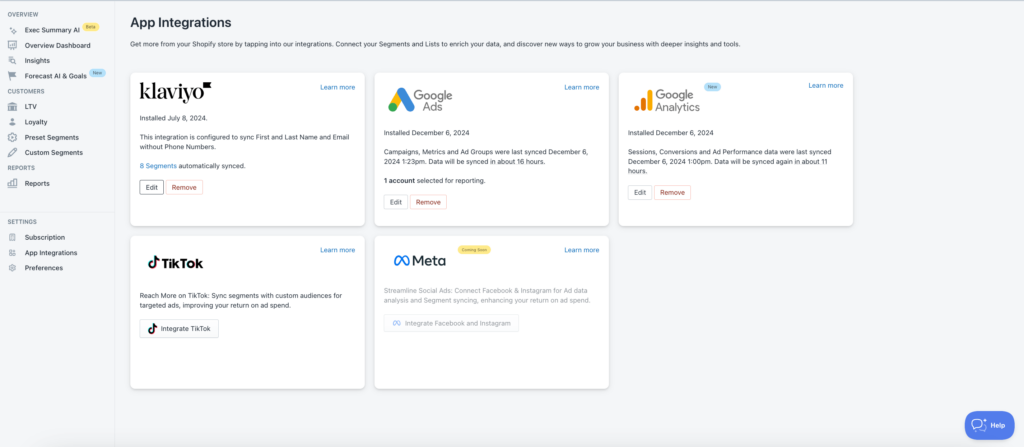
When you integrate these segments onto your platforms, it will also take the segments data from those platforms and put them into all the reports on By the Numbers.
Book a free session with a data expert if you need help understanding your BtN reports.

By the Numbers
Empower your business with our Shopify Data Driven App

- ✔ Know Your Audience Behavior
- ✔ Deep Customer Segmentation
- ✔ Retarget With Integrations
- ✔ All The KPIs & Reports You Need

